Creating Smart Mindmaps
Background
A suite of feature updates for a web-based infographic creation tool that allows both external users and internal graphic designers to work smarter.
Tools
Figma, EnjoyHQ, Mixpanel, Trello
Role
Product Designer – strategy, wireframing, high fidelity assets, project owner
Project Timeframe
3 months
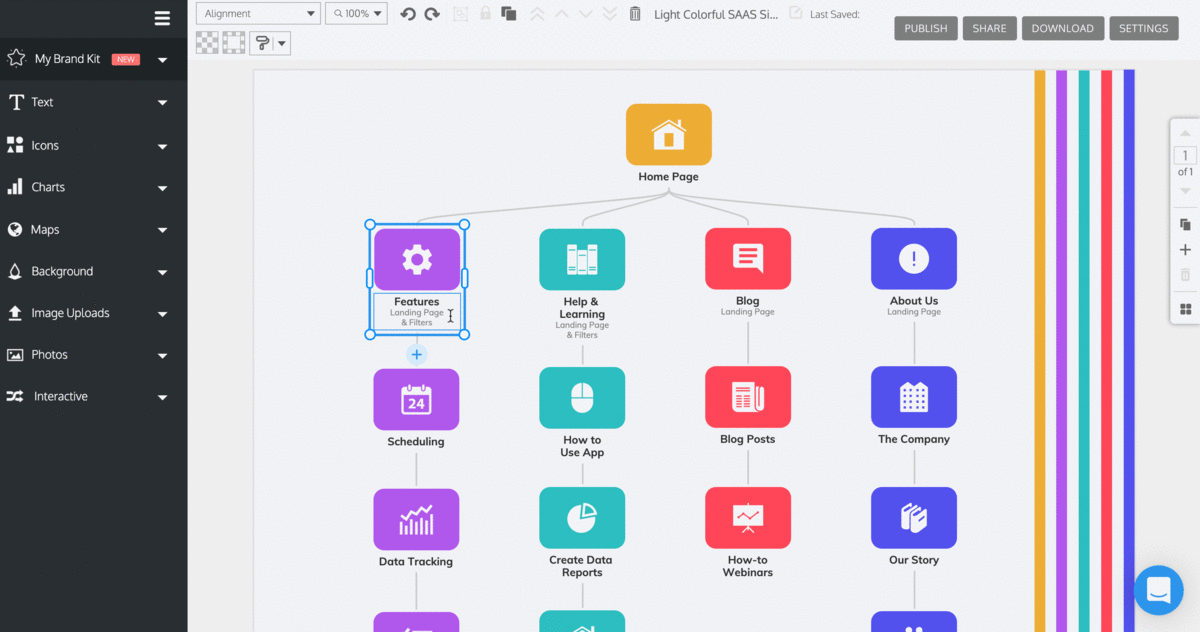
Mindmapping made smarter
Working as a Product Designer in early 2021, I had the opportunity to create and implement new front-end features for a “Smart Diagram” creation & editing tool.
This suite of features serves as the foundational framework for further “Smart Mindmap” development, and required a close collaboration with the engineering and QA teams to achieve within technical limitations, while providing an avenue for future improvements.
Features at a glance
- New copy & paste split button that allows users to edit styles between diagram elements, to allow the storing & editing of CSS style data.
- New line styling options & style guide to allow users to join diagram nodes together in a chart to develop a more robust connector line script & logic.
- A redesigned node editor flow to allow the graphic design team to scale infographic template production faster, and allowing the “Smart Diagram” DOM layer to more closely integrate with legacy elements.
Copying & Pasting Styles
Problem
When users add new nodes to a diagram, how should the new node look? What characteristics should be inherited and which should be default? How much work is there in editing each element manually?
Technical Limitations
When we started, styling data was not recorded on a per-item basis. A few new paramenters needed to be added so that CSS styling data could be referenced and applied as required.
What are style elements?
A descriptive list of what constitute as a “stylistic” element that could be copied between nodes served an important purpose in defining exactly what needed to be included between nodes.
- Font: family, size, weight, line height, colour
- Background: colour, opacity
- Borders: colour, width, radius
- Icons: alignment, background colour, opacity
- Images: alignment, background colour
- Node: horizontal width, scaled size
User Jobs to be Done (JTBD)
Our core user group of working professionals with limited graphic design backgrounds need to present infographic ideas quickly & with minimal editing. A simple, one-button approach to copying & pasting styles would appeal the most to this demographic.
Solution
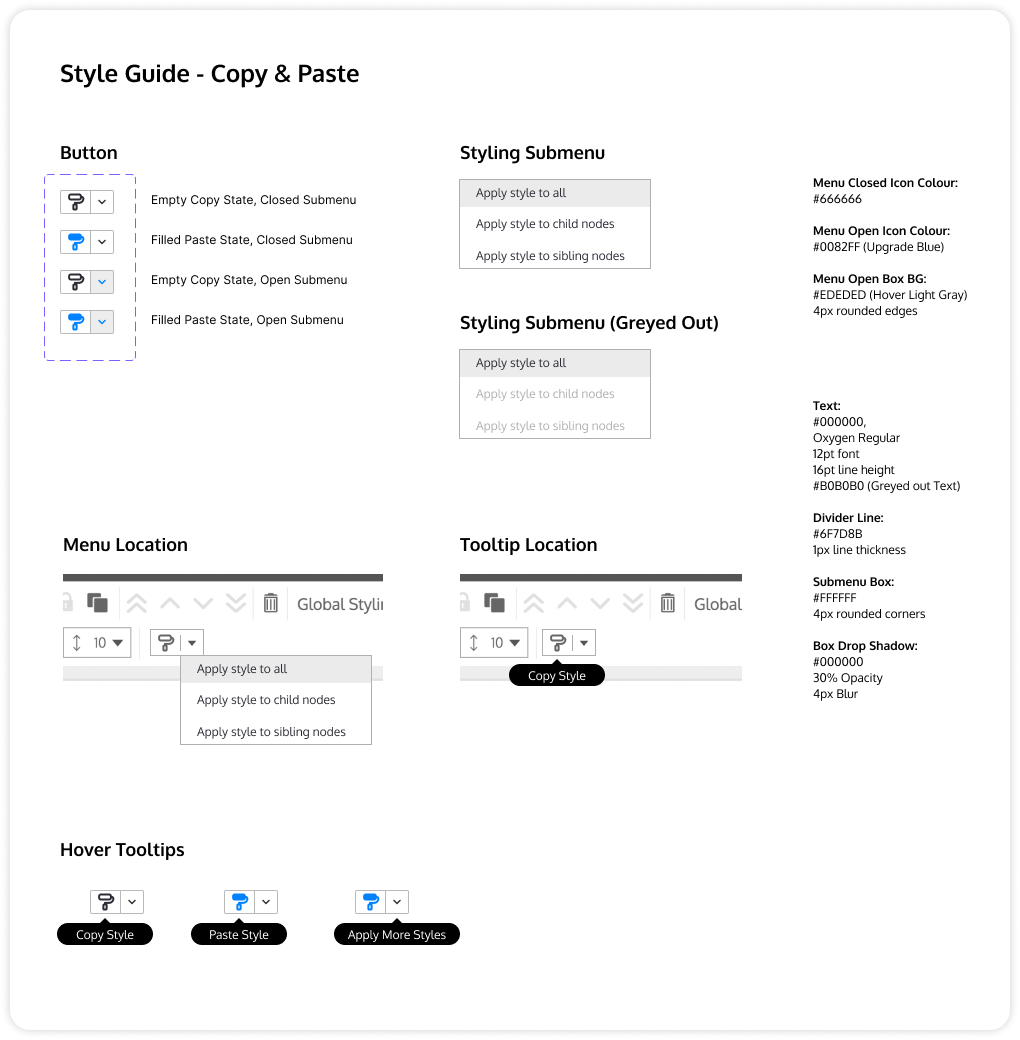
The solution of a split button was created from a few rounds of internal team feedback, and extensive product testing in multiple scenarios. The split button is a button with two components – an icon & a dropdown arrow. Clicking the icon selects the “default” action, while the arrow provides a list of secondary actions.
This solution provides a suitable solution to the user through its easily discoverable default option (copy & paste), while also providing more advanced options that are visually seperated but still discoverable for more advanced users.
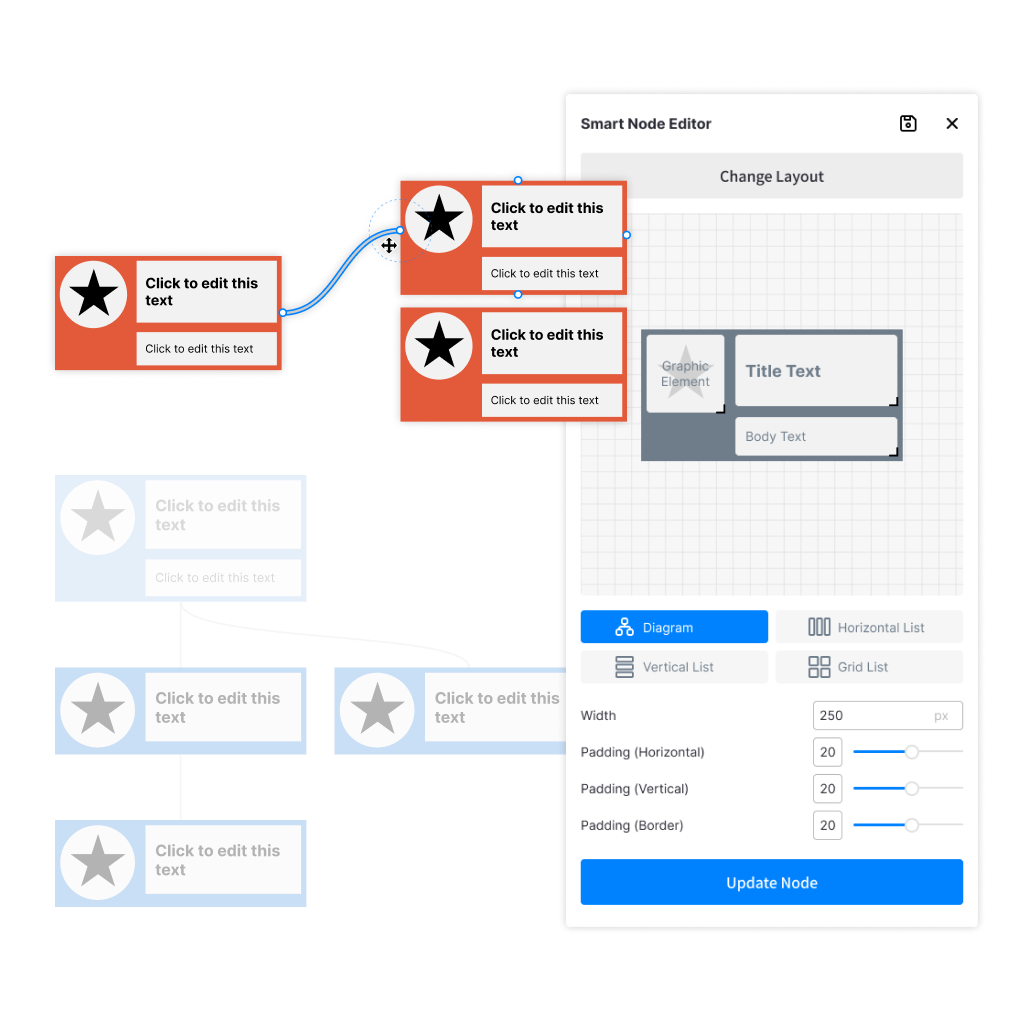
Example: Copy and paste between nodes
A user can click once on the copy button to pick up the style they want to copy, then select another element(s) on the page and paste back the style.
Example: Using advanced dropdown options
A user can click to expand more options, such as pasting style data to all elements within a mindmap, or to the elements that are connected to it.
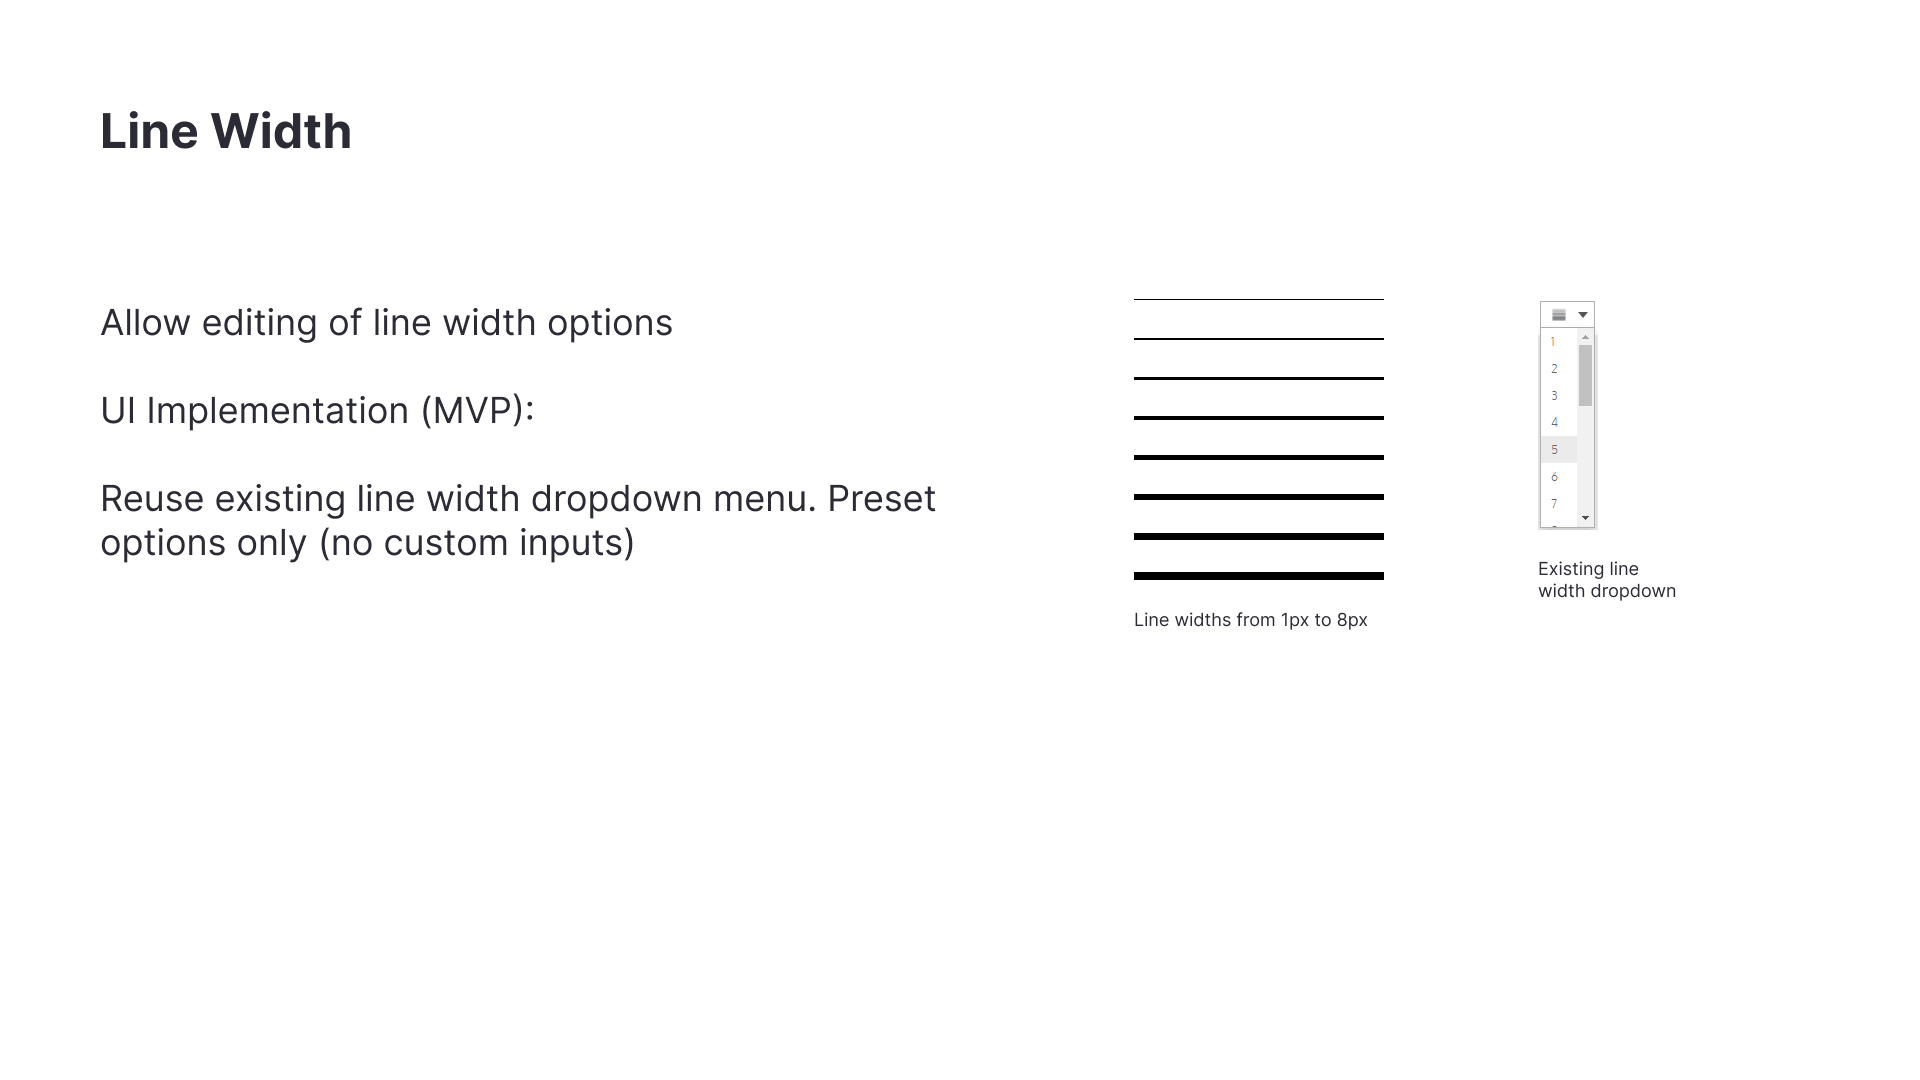
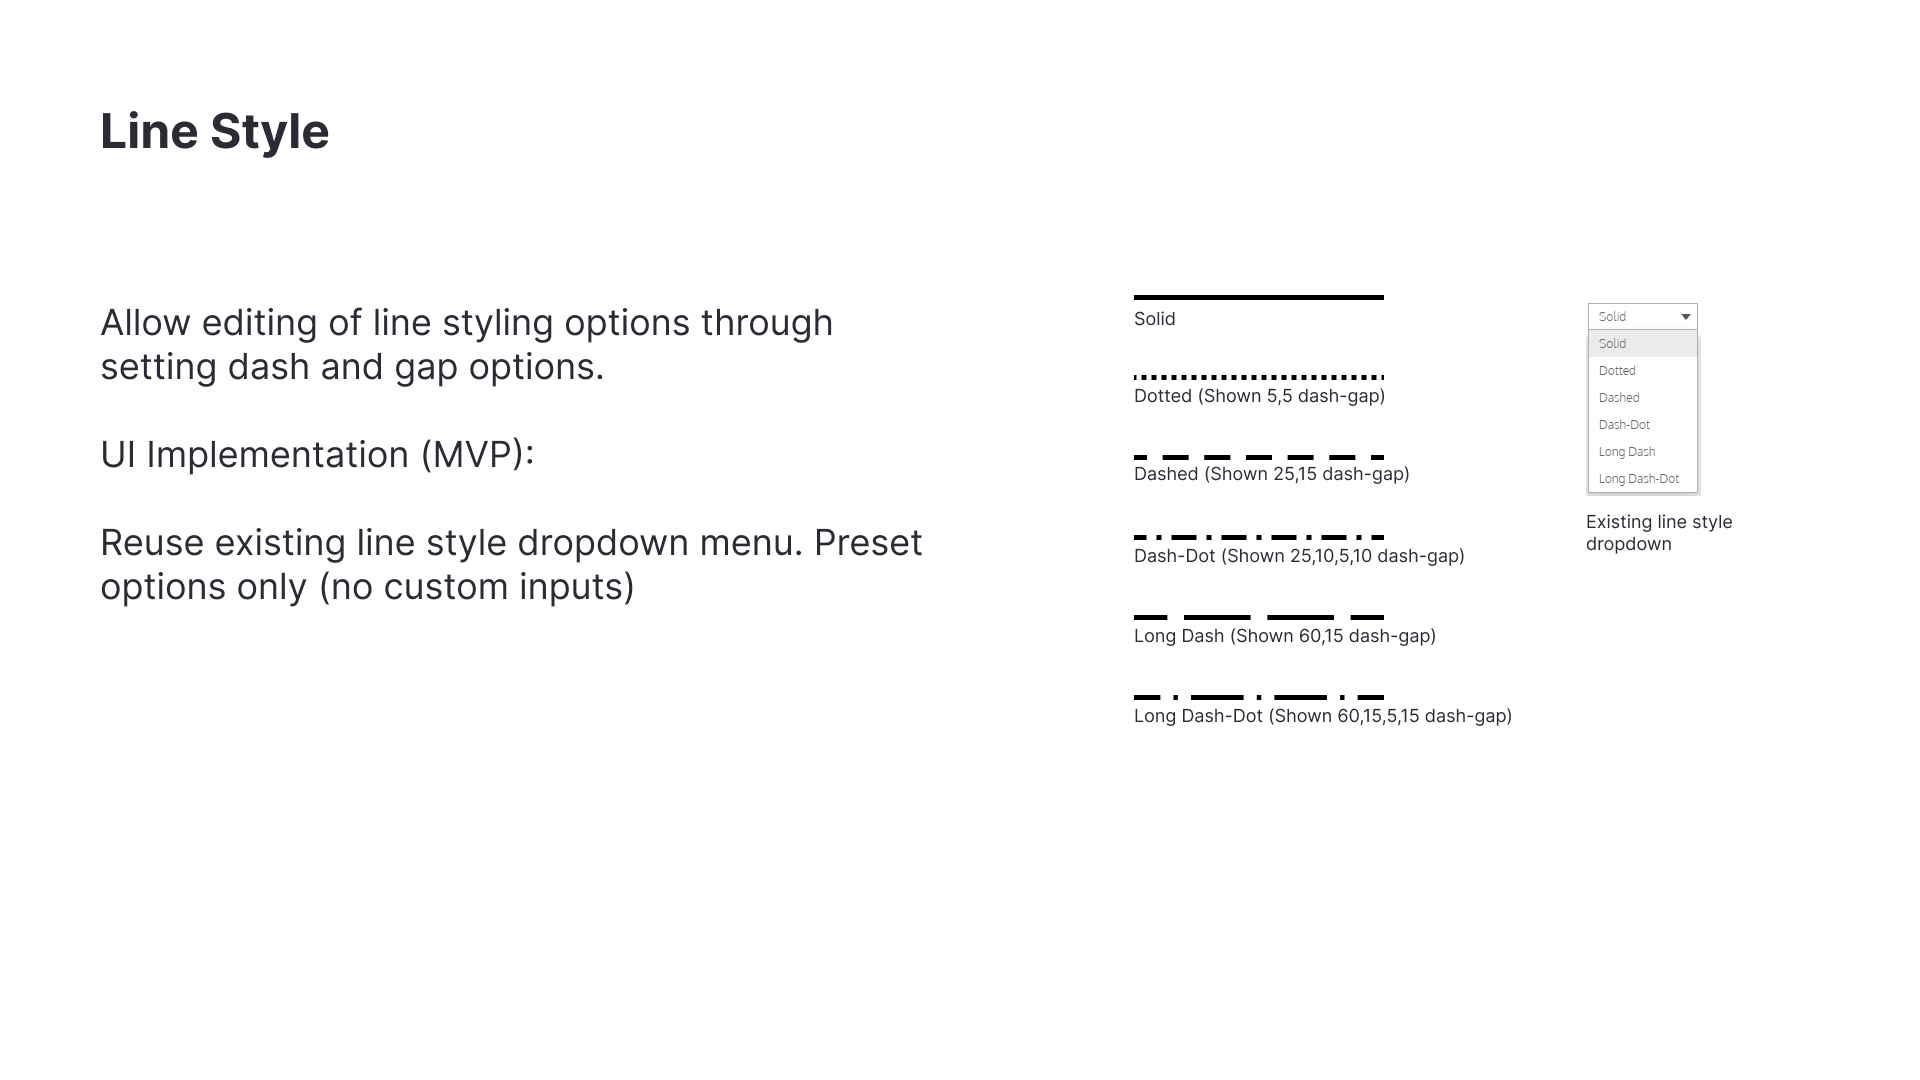
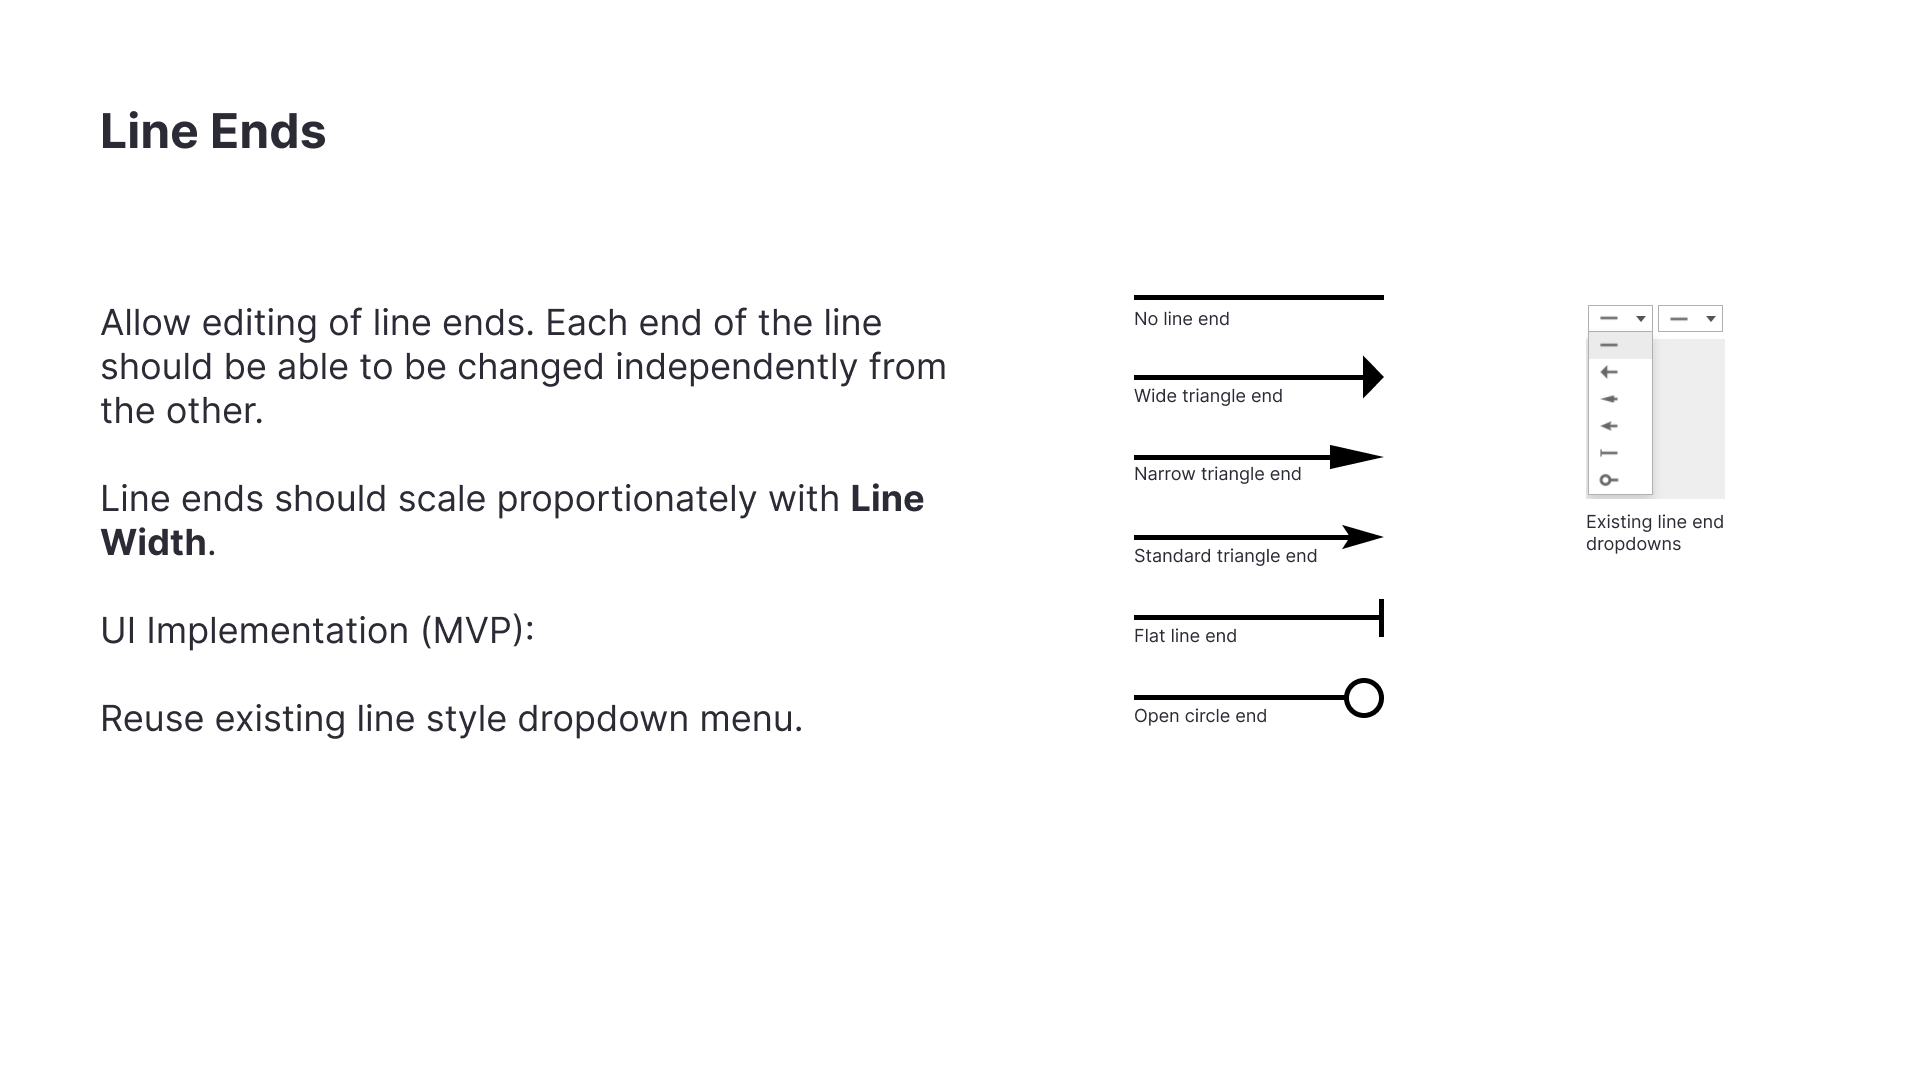
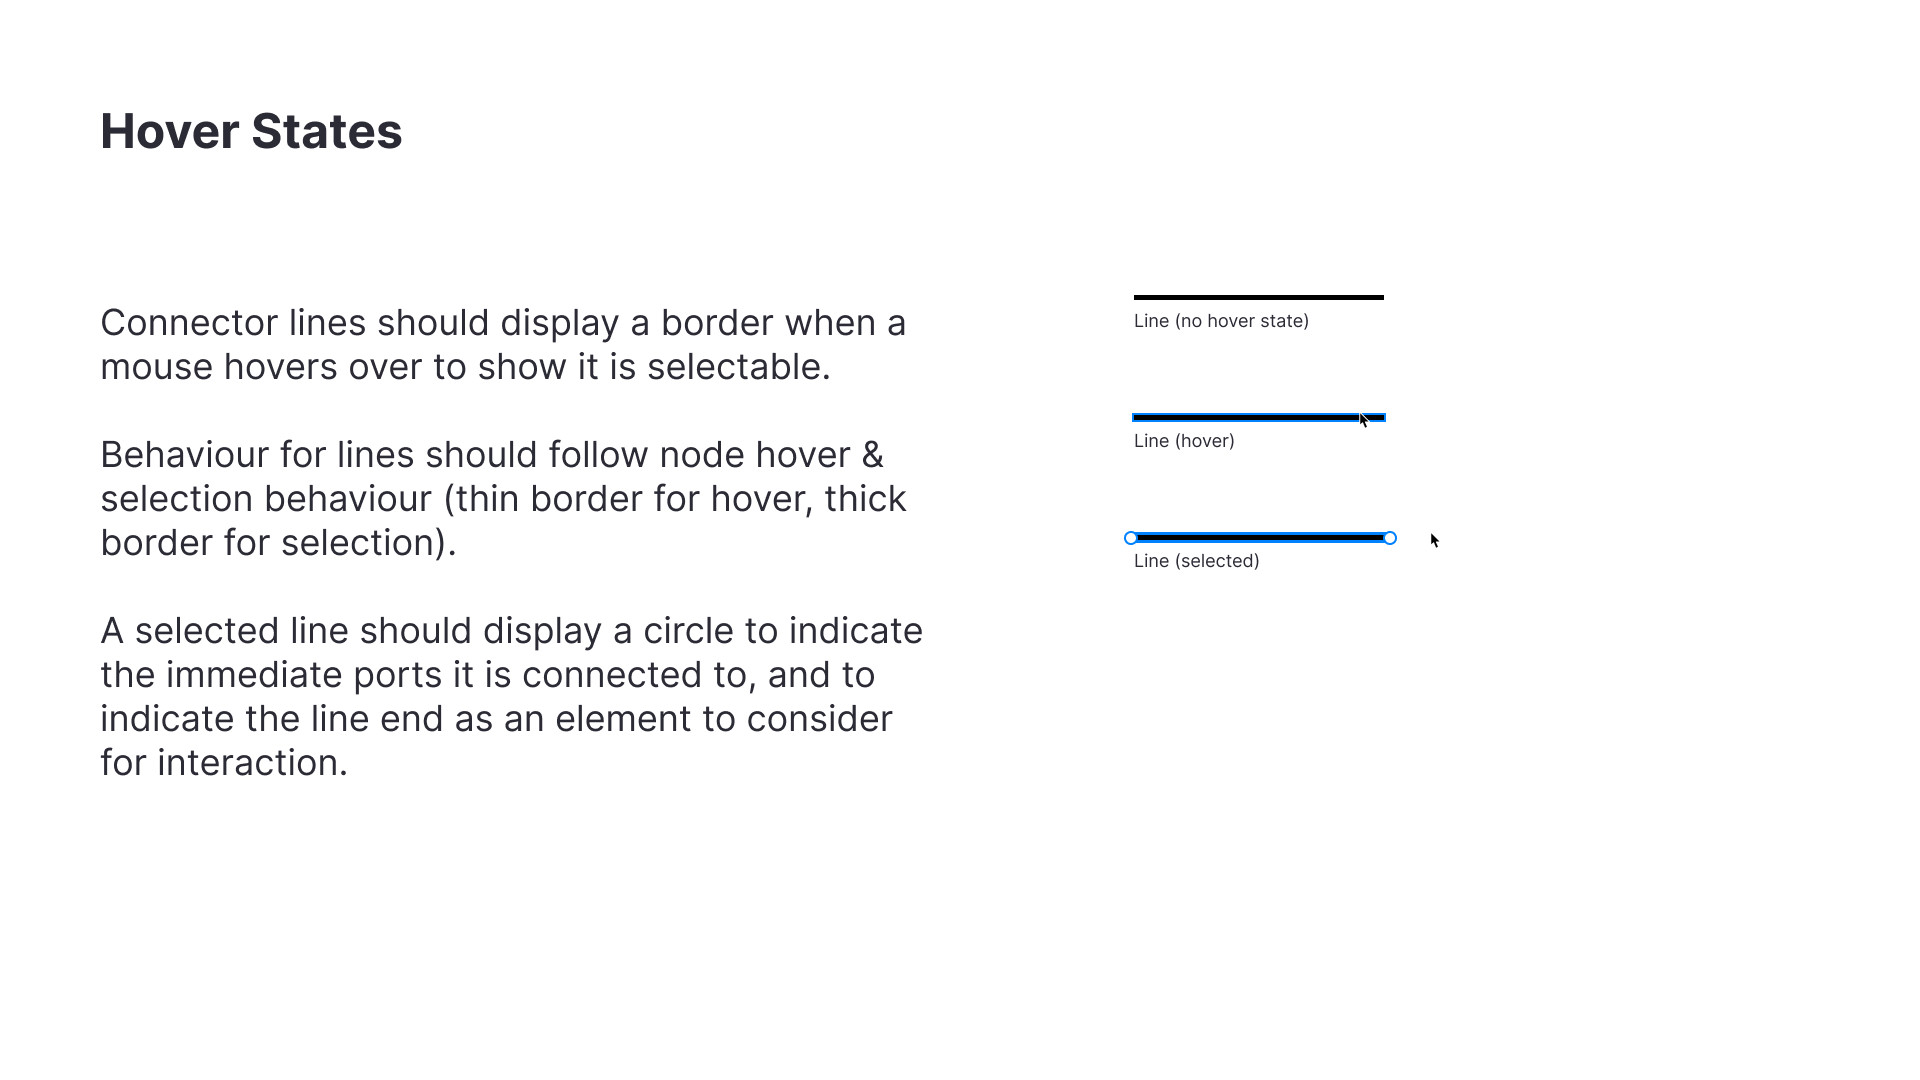
Line Styling
Problem
As users look to other ways to diagram, how might we offer connector lines so that users can create mindmaps?
Technical Limitations
Connector lines was driven by a simple third party React library, were not editable, and provided just one appearance setting. A new & more robust library was needed to implement line styling.
Solution
The line styling style guide was shaped based on input from the developers, and through competitive analysis with other tools that offer connector lines. The things that should be editable include:
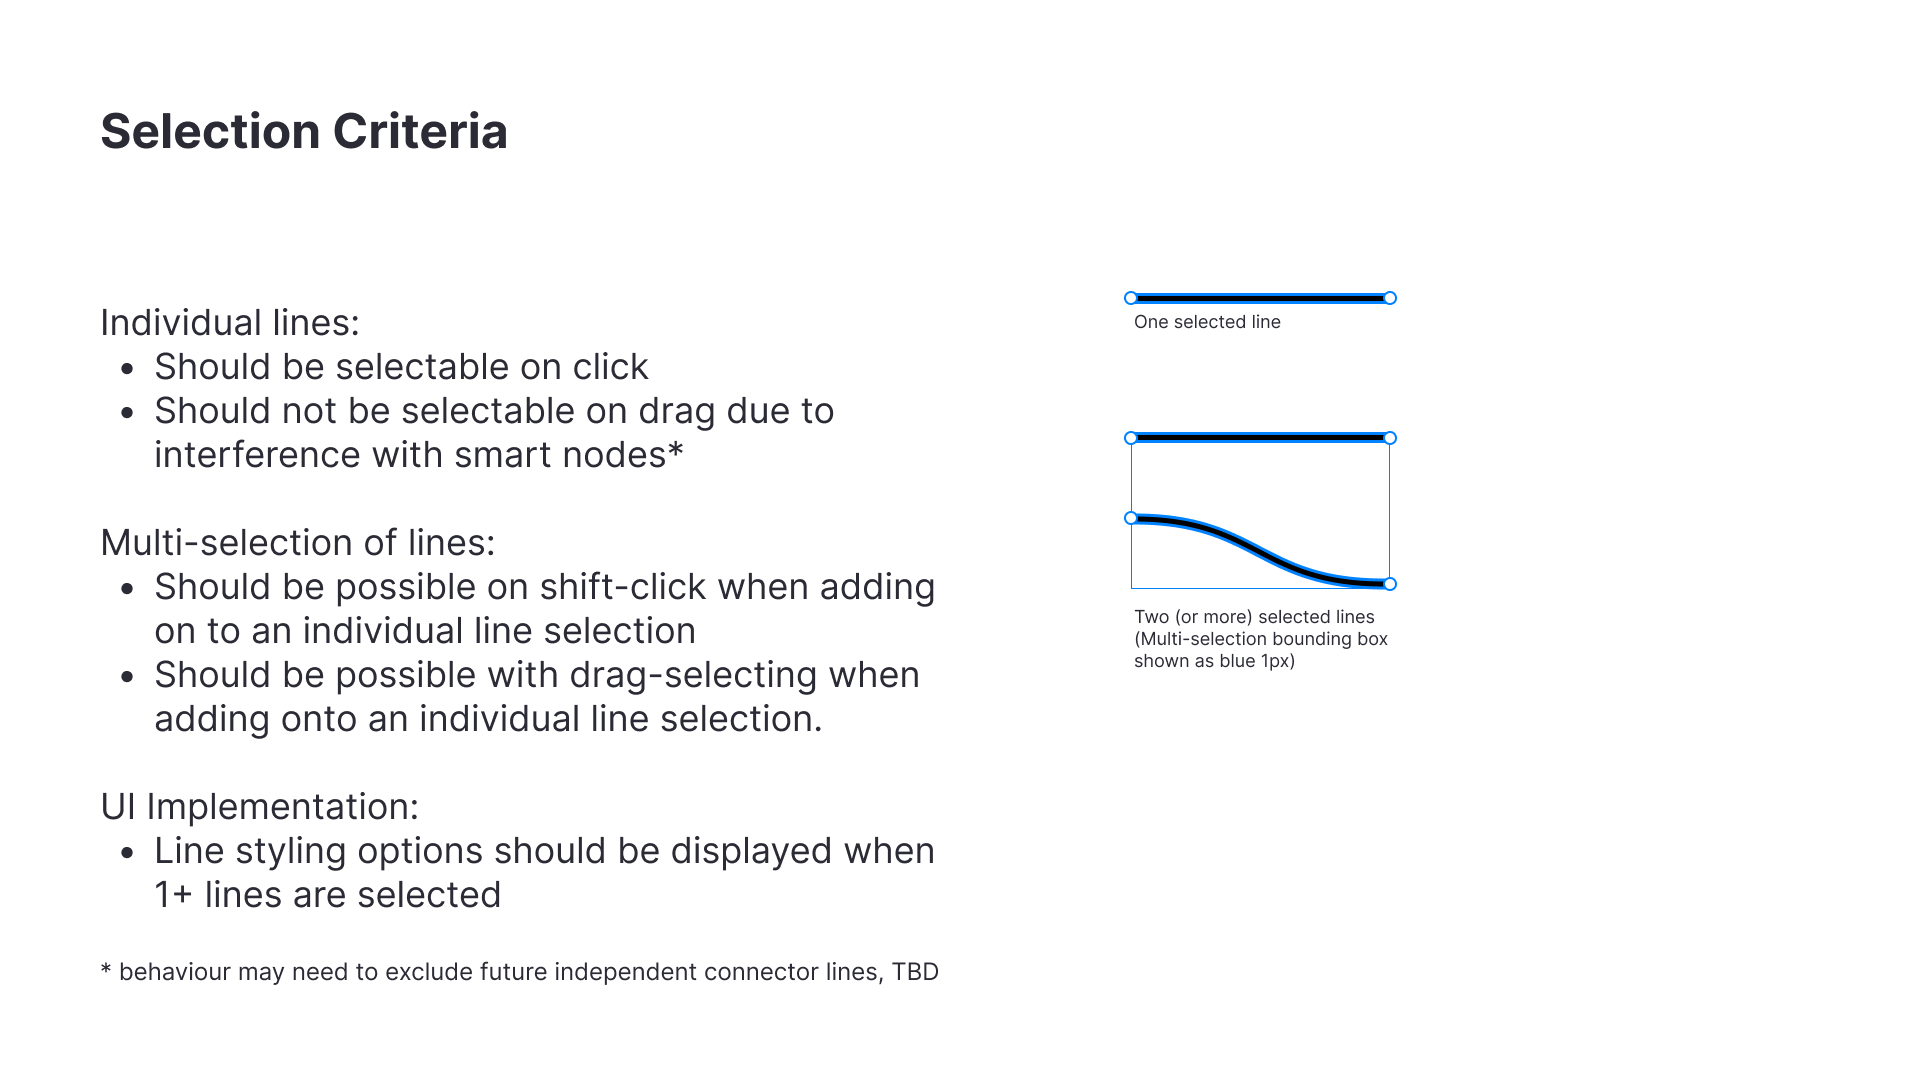
- Customizable: lines can be changed based on colour, type, width, dashes, and line ends.
- Selectable: lines need hover states and selection boxes to show active state.
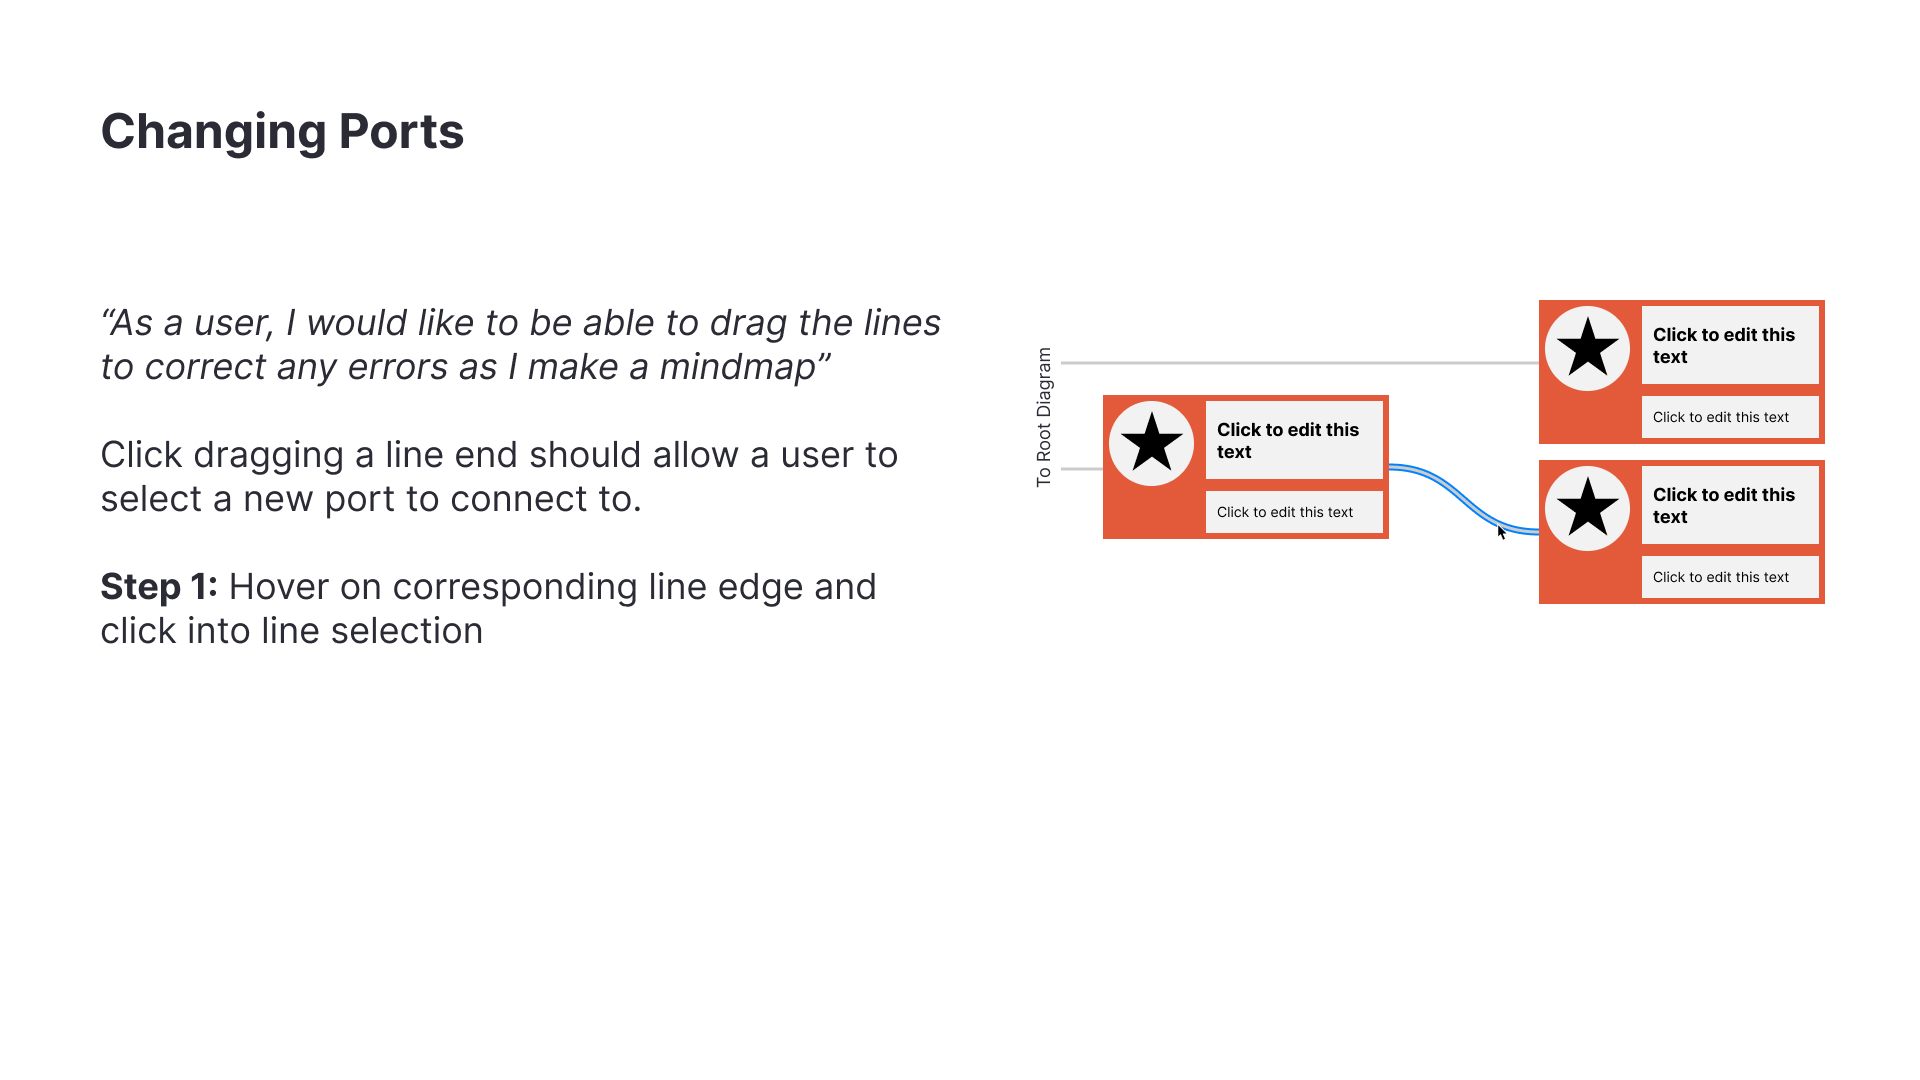
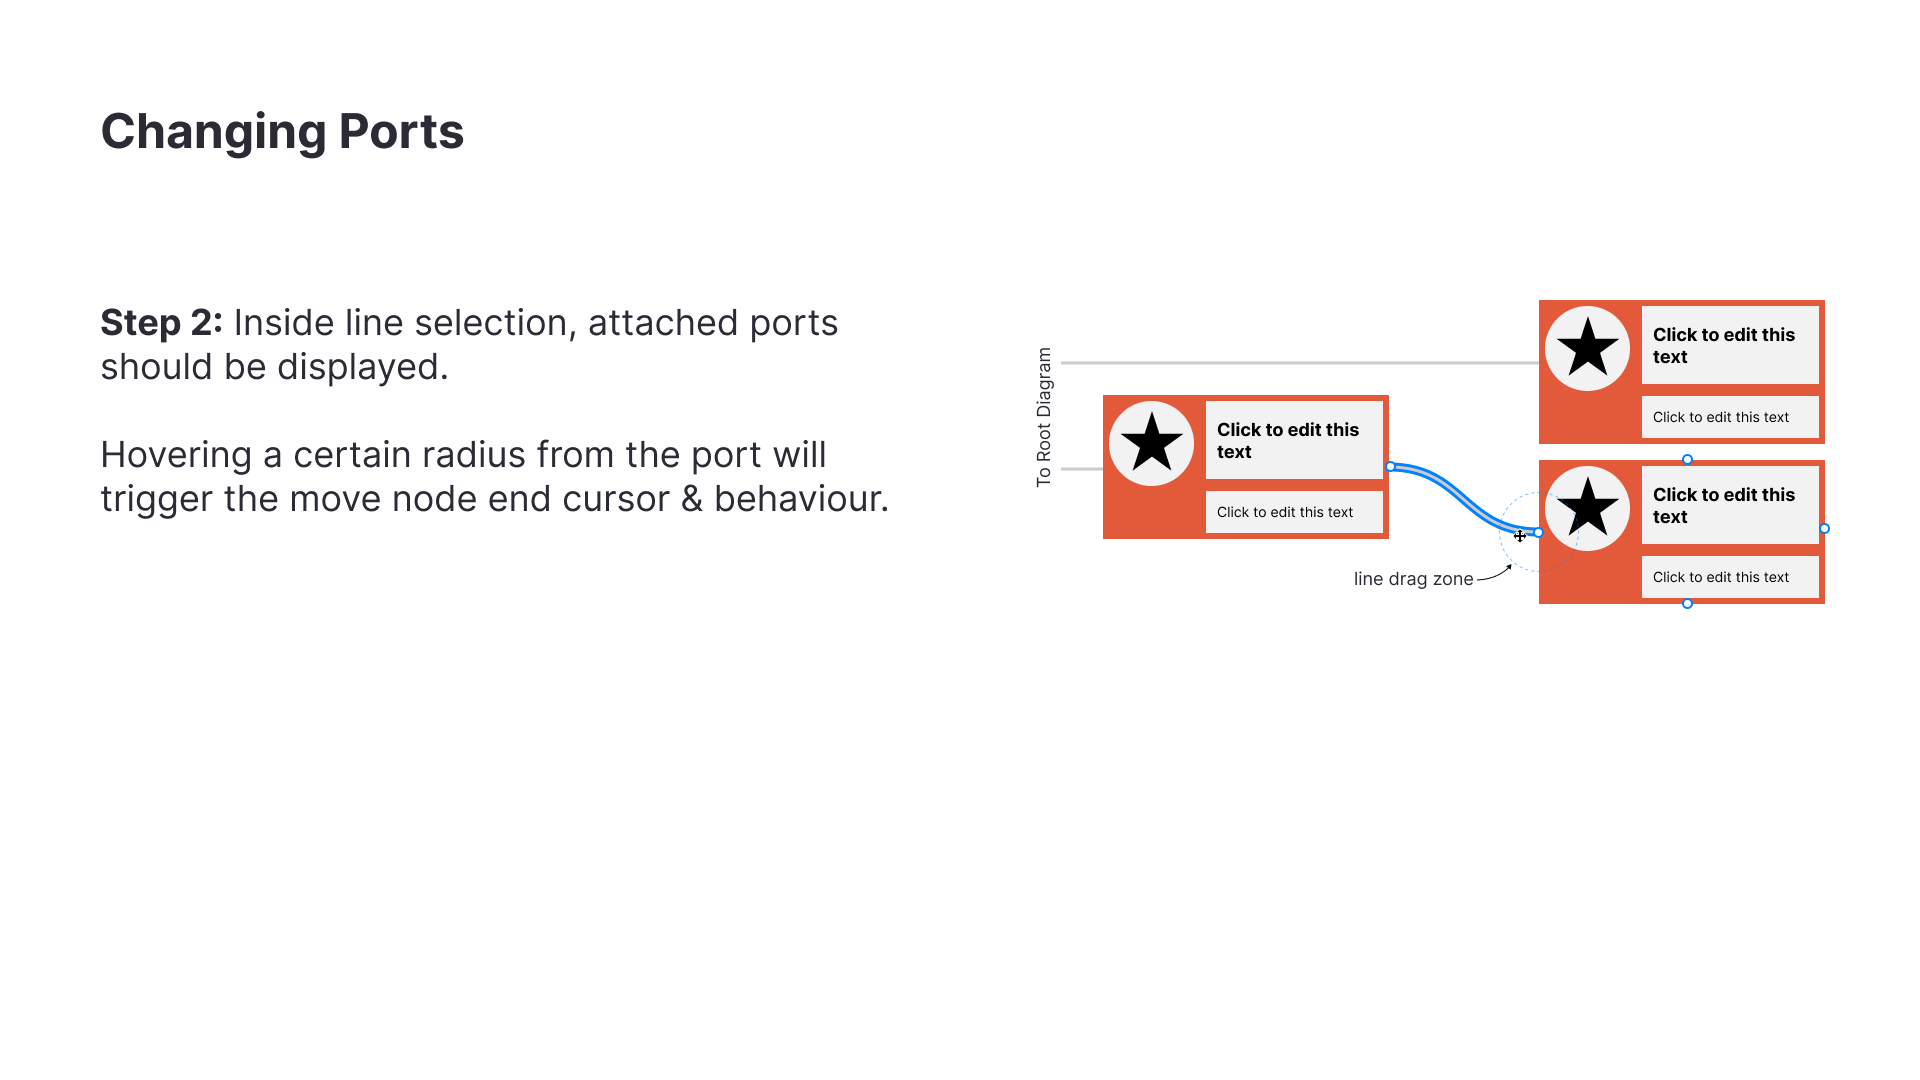
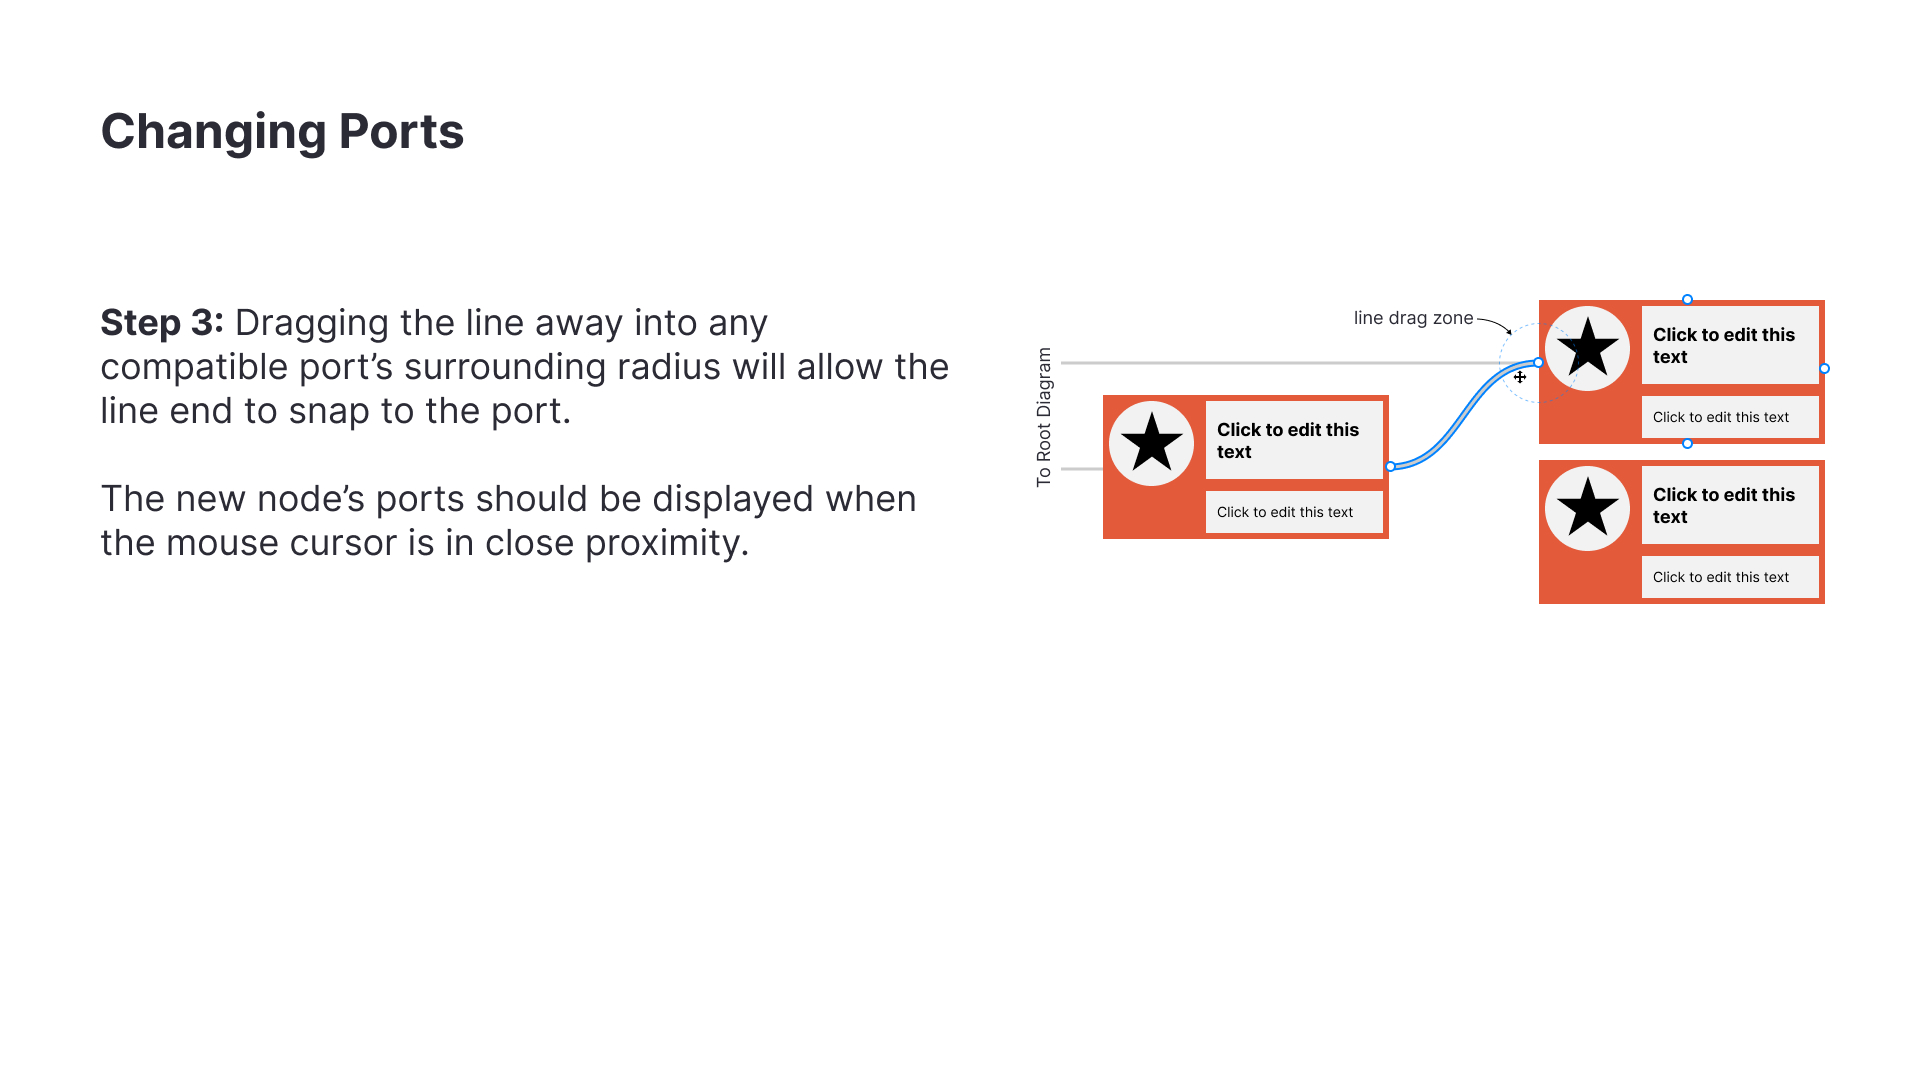
- Draggable: lines can connect & disconnect when dragging on the end(s).
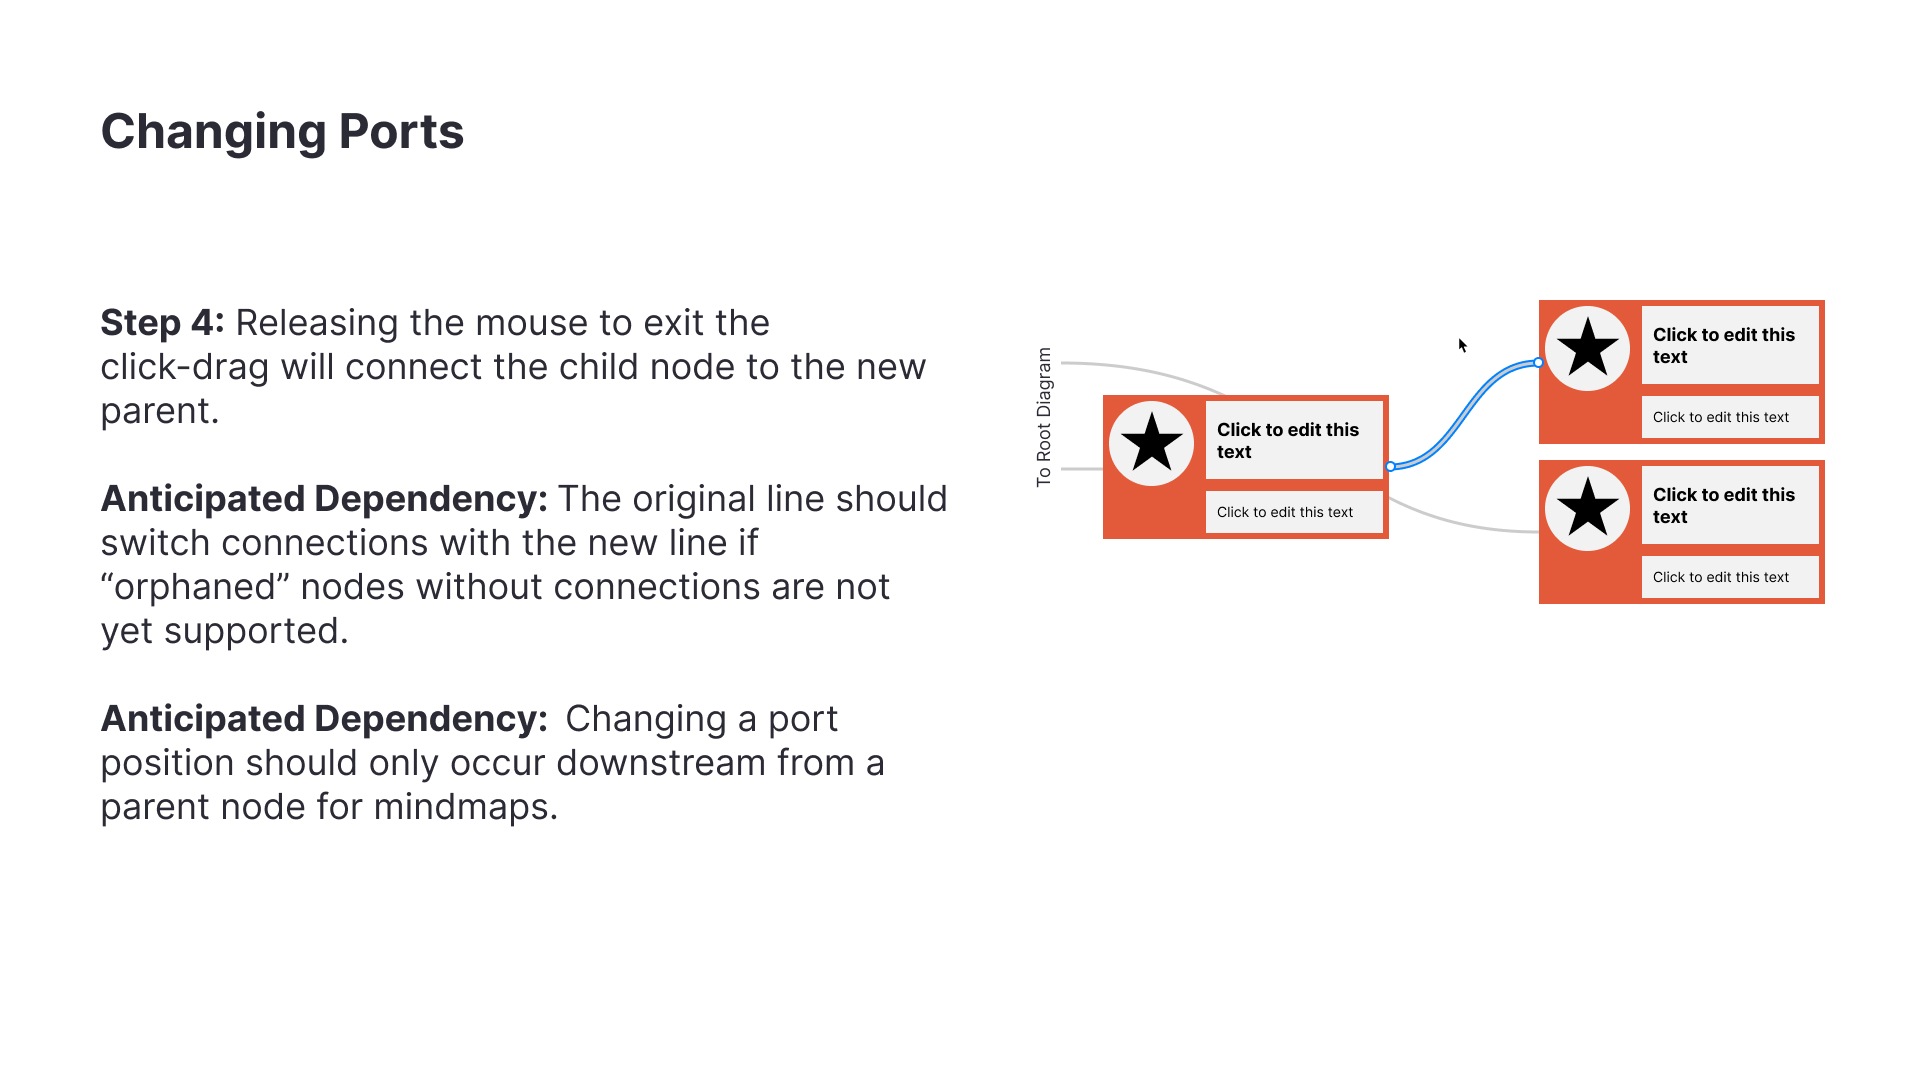
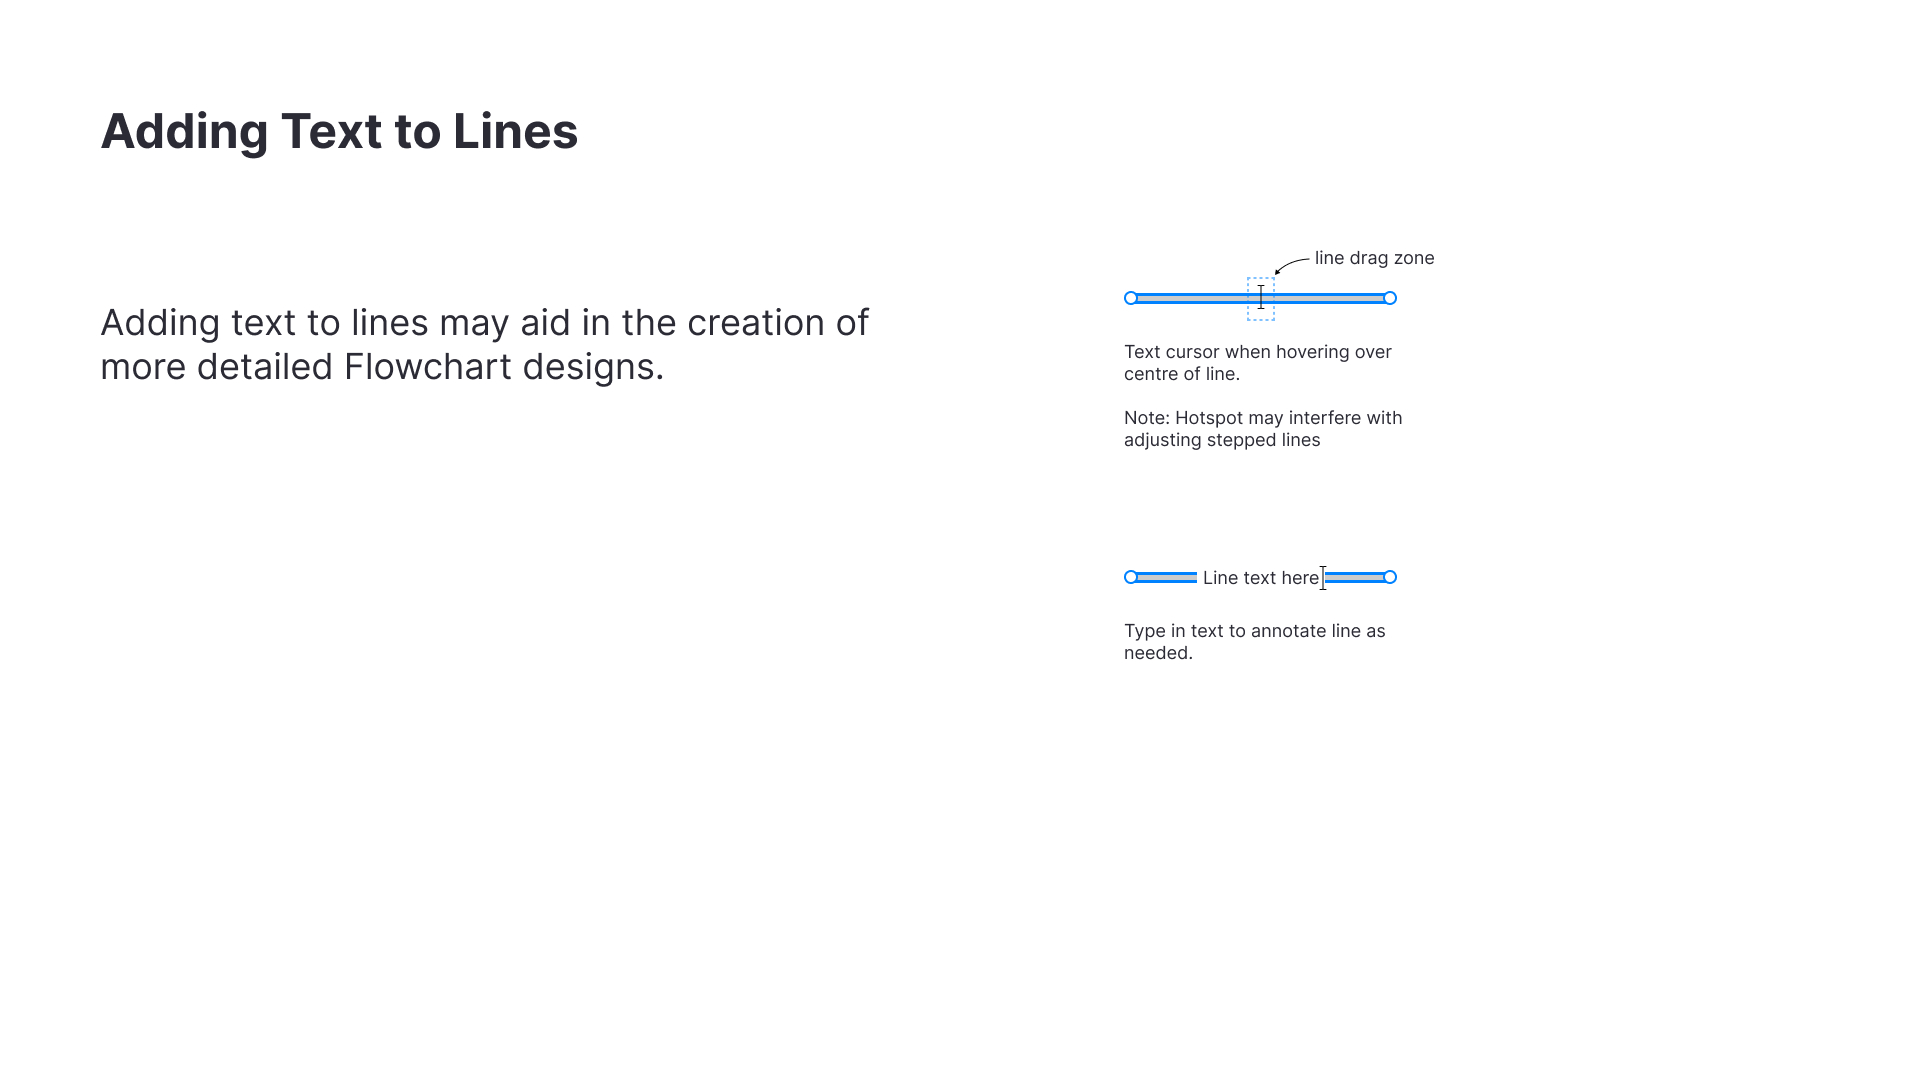
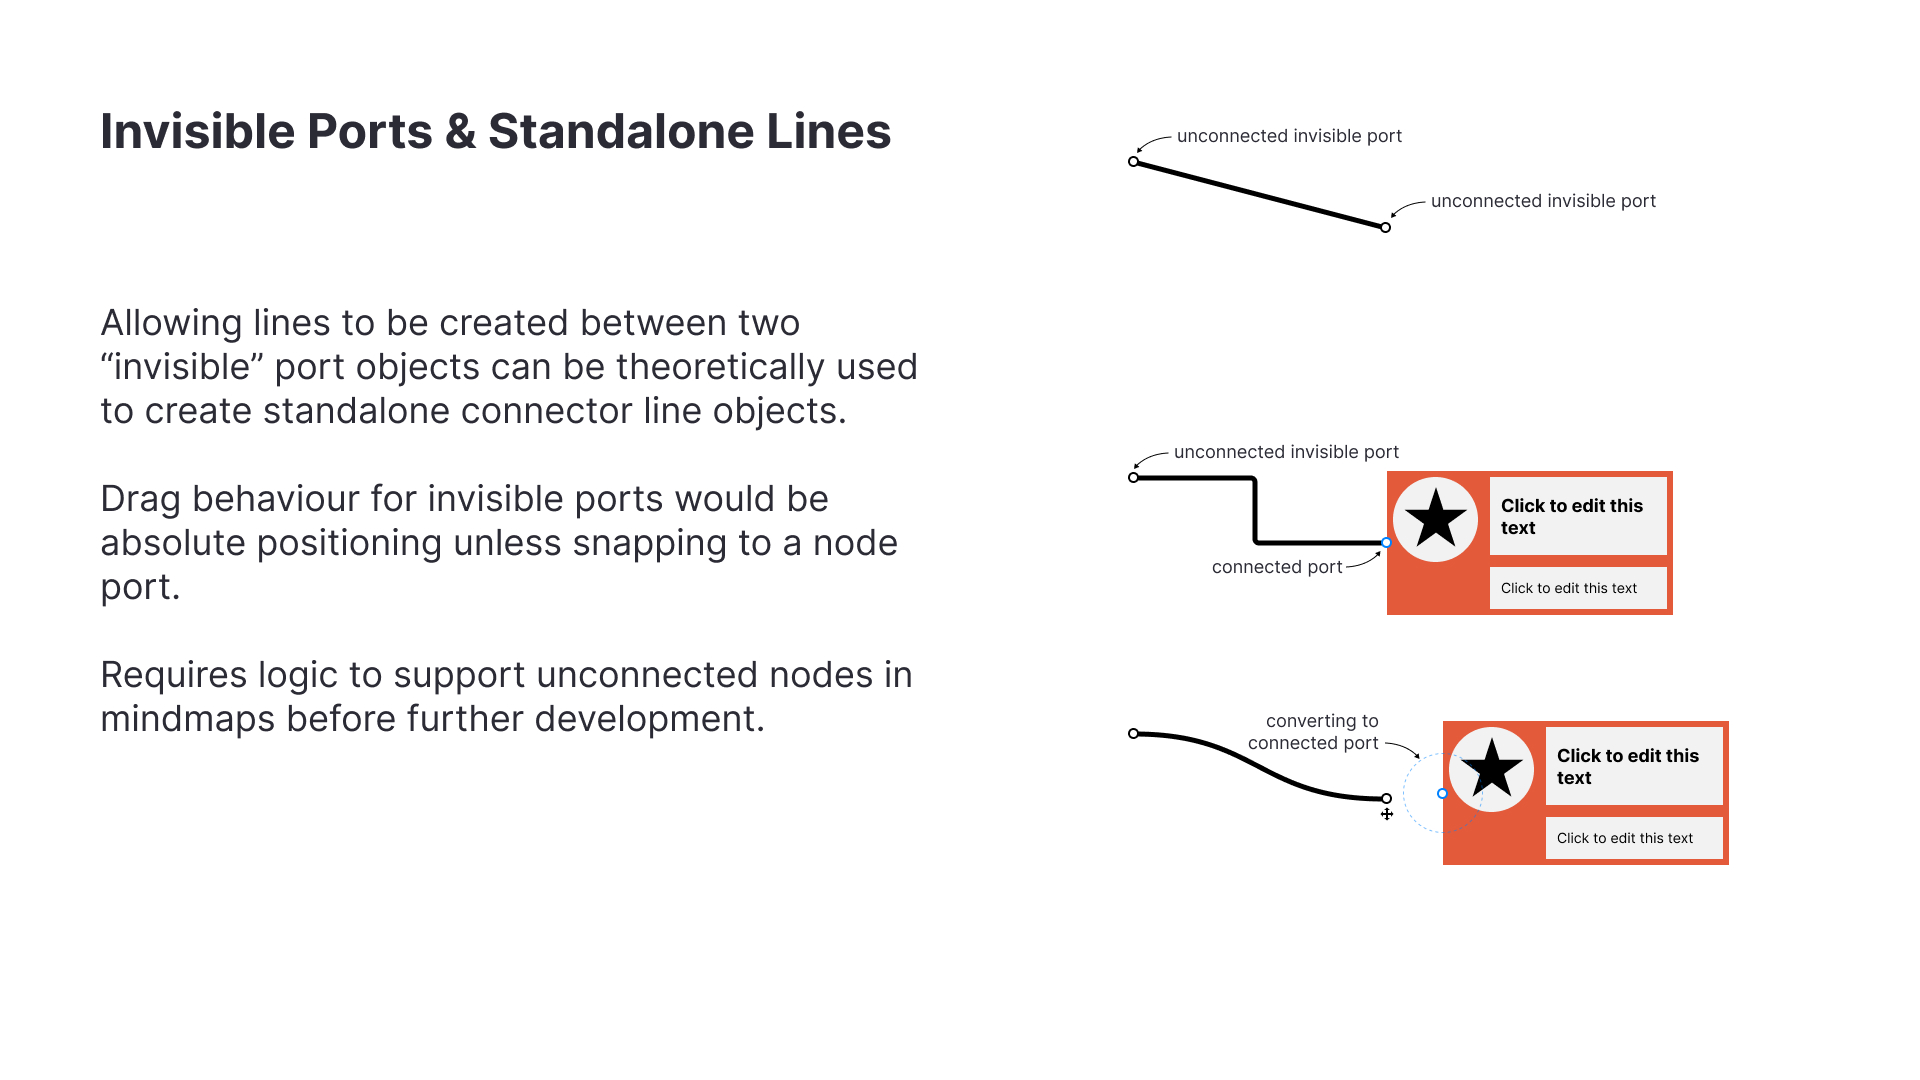
Future Nice to Haves
While what was presented are considered “table stakes” items, future nice to haves listed below would be features that can be built on the framework presented:
- Adjustable stepped lines
- Text on lines
- Standalone line elements
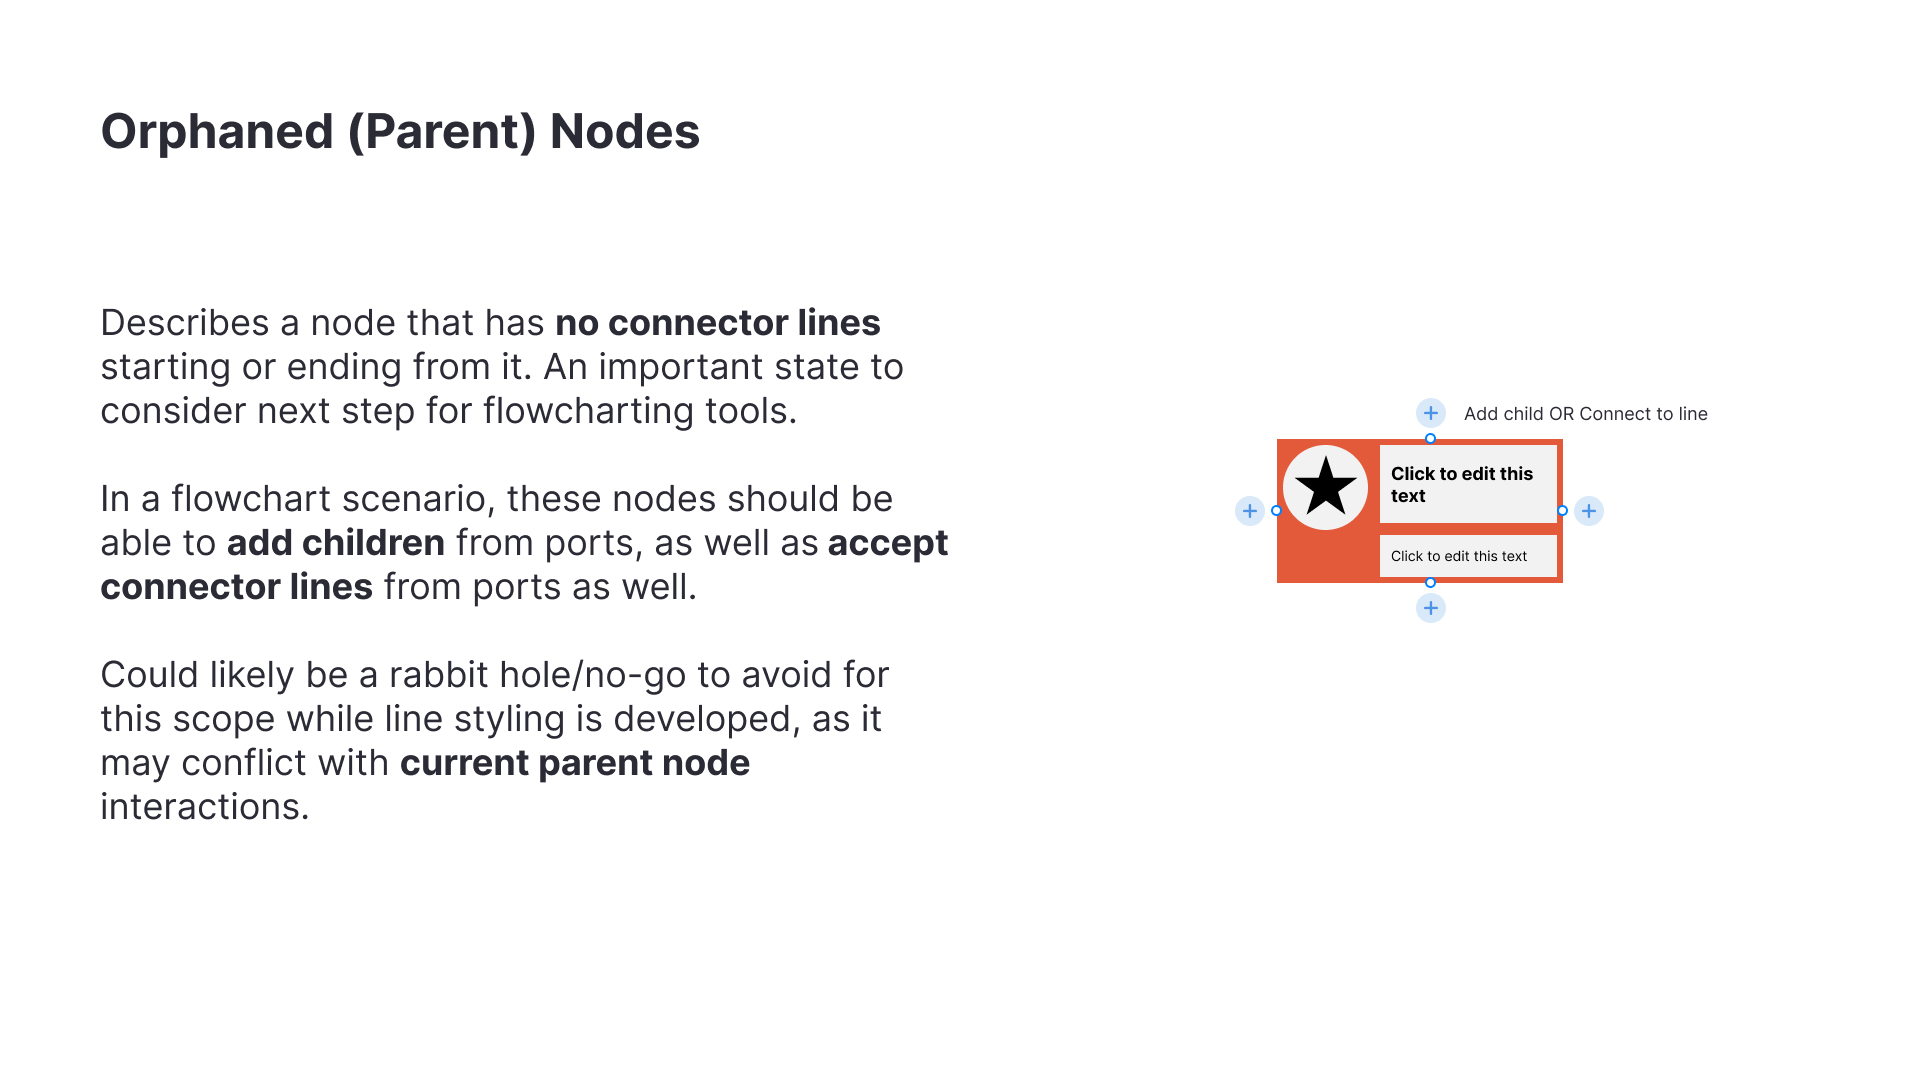
- Orphaned Nodes
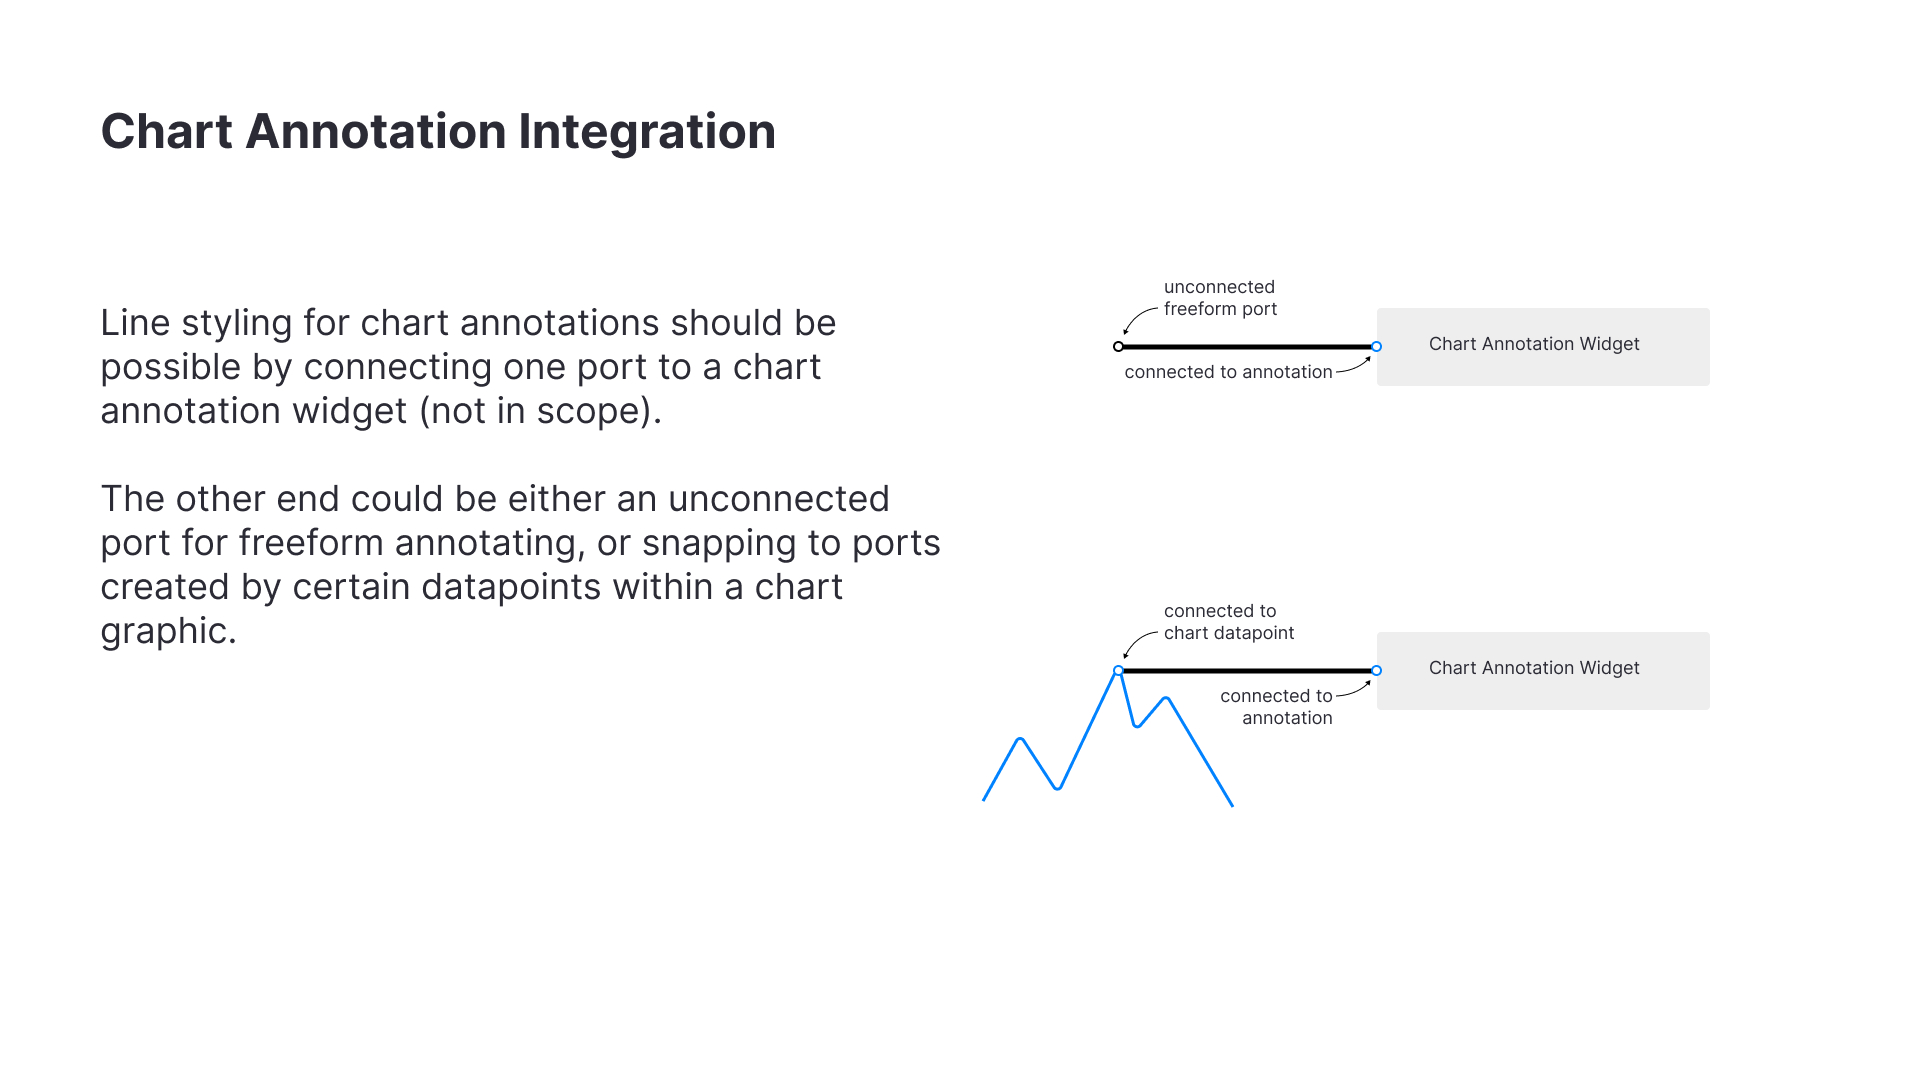
- Chart annotation integration
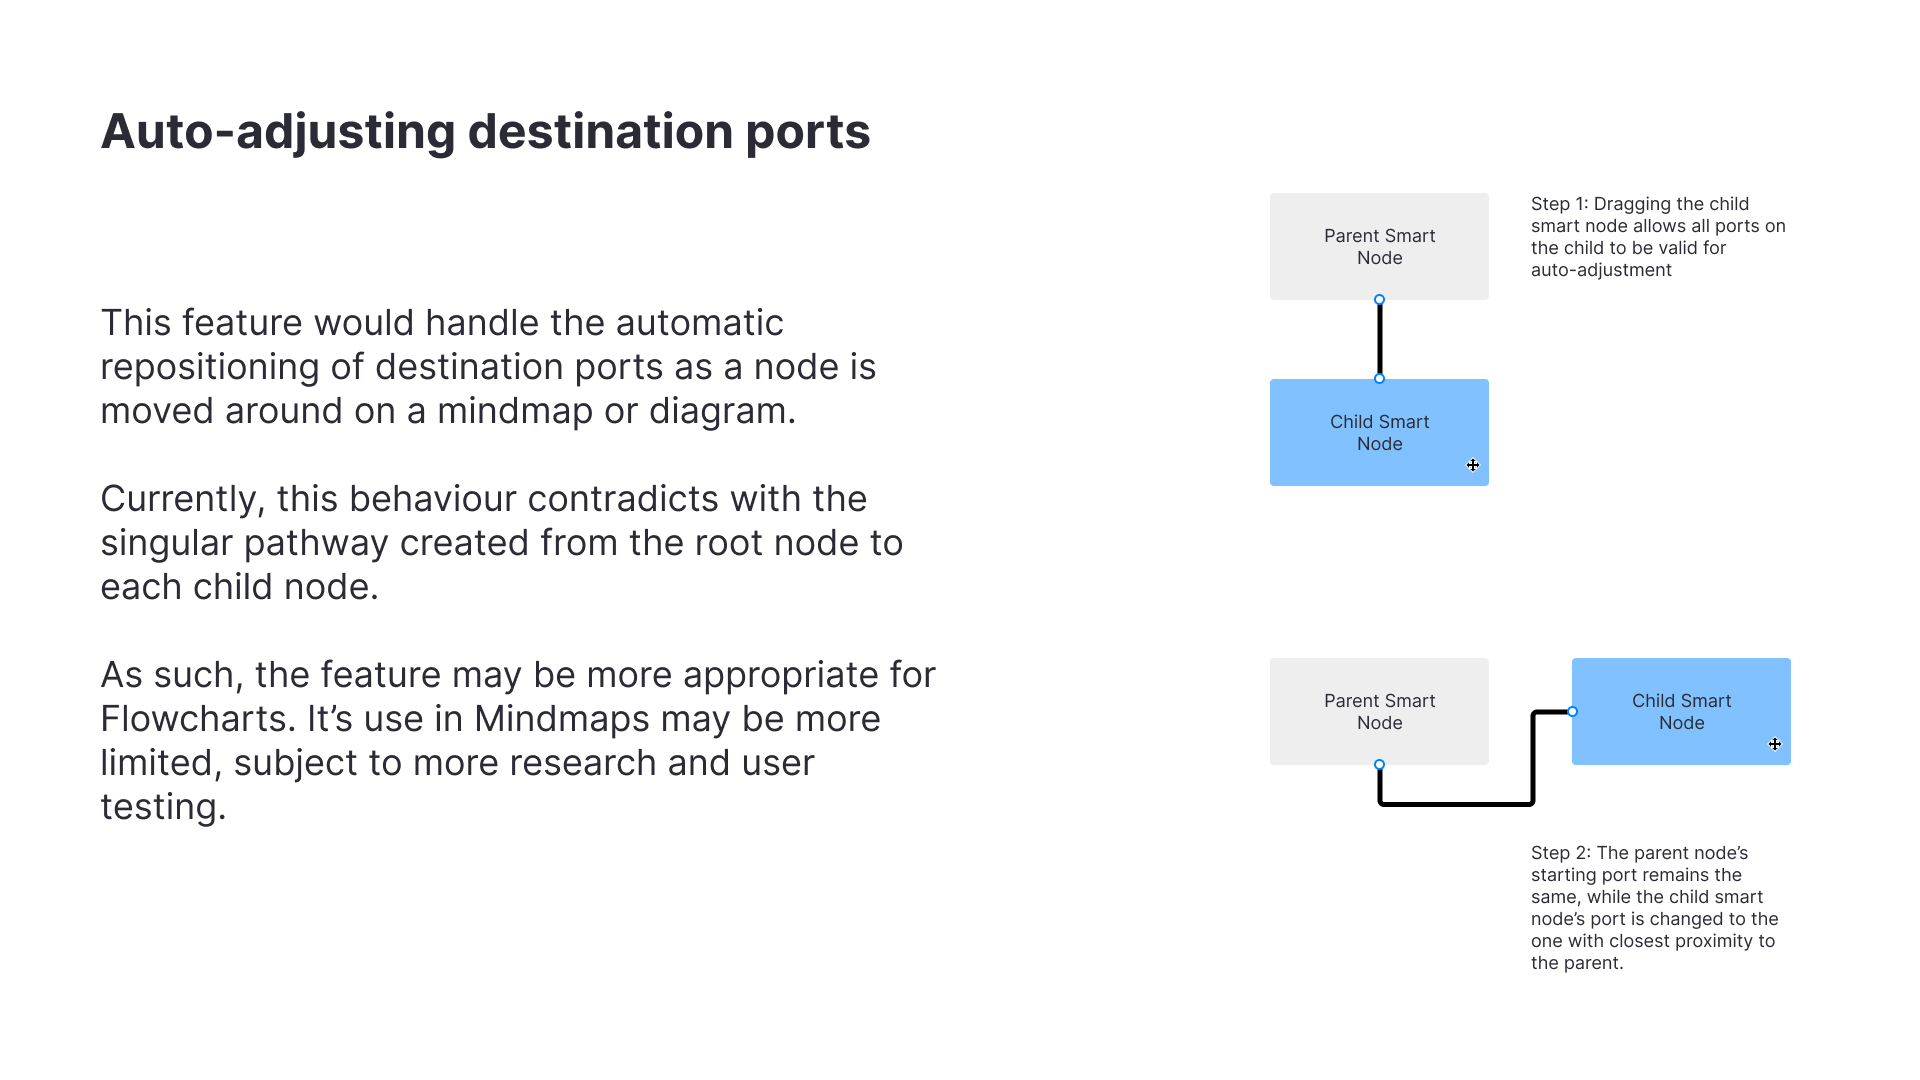
- Auto-adjusting destination ports
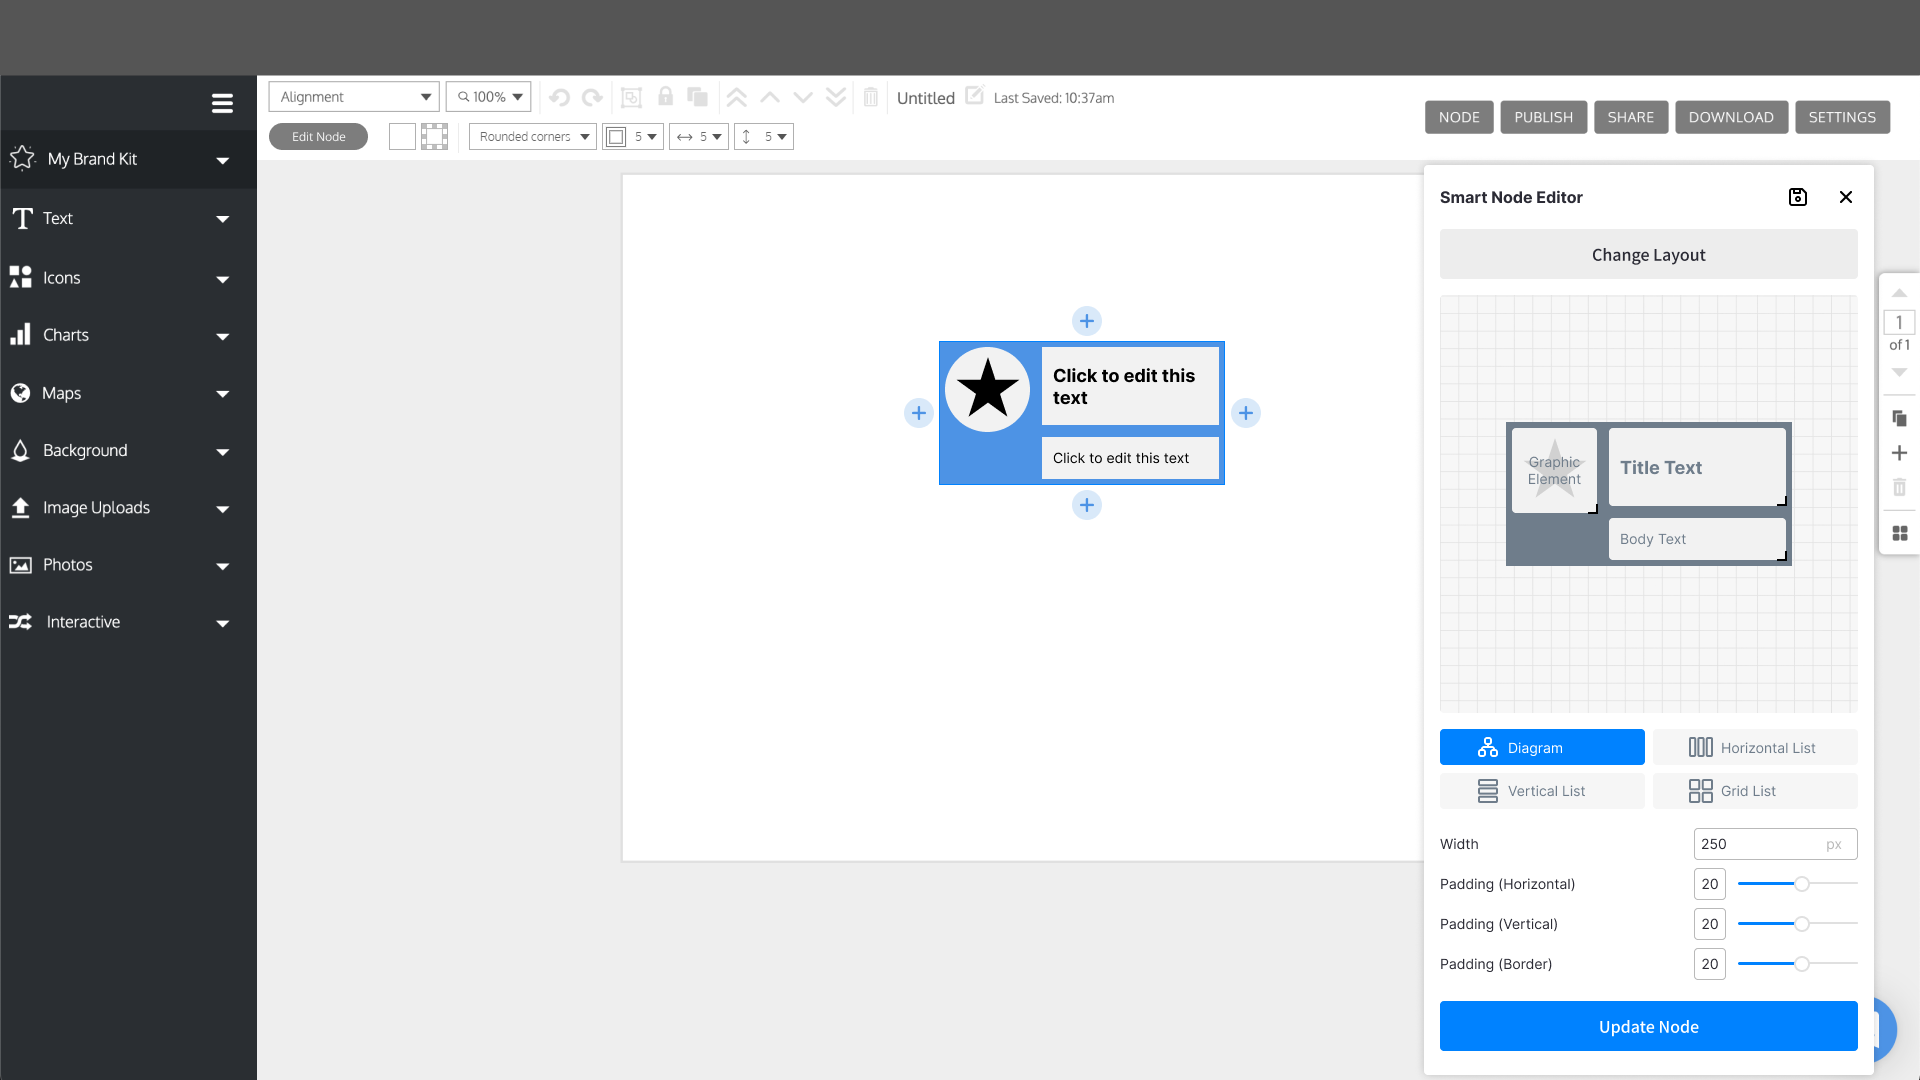
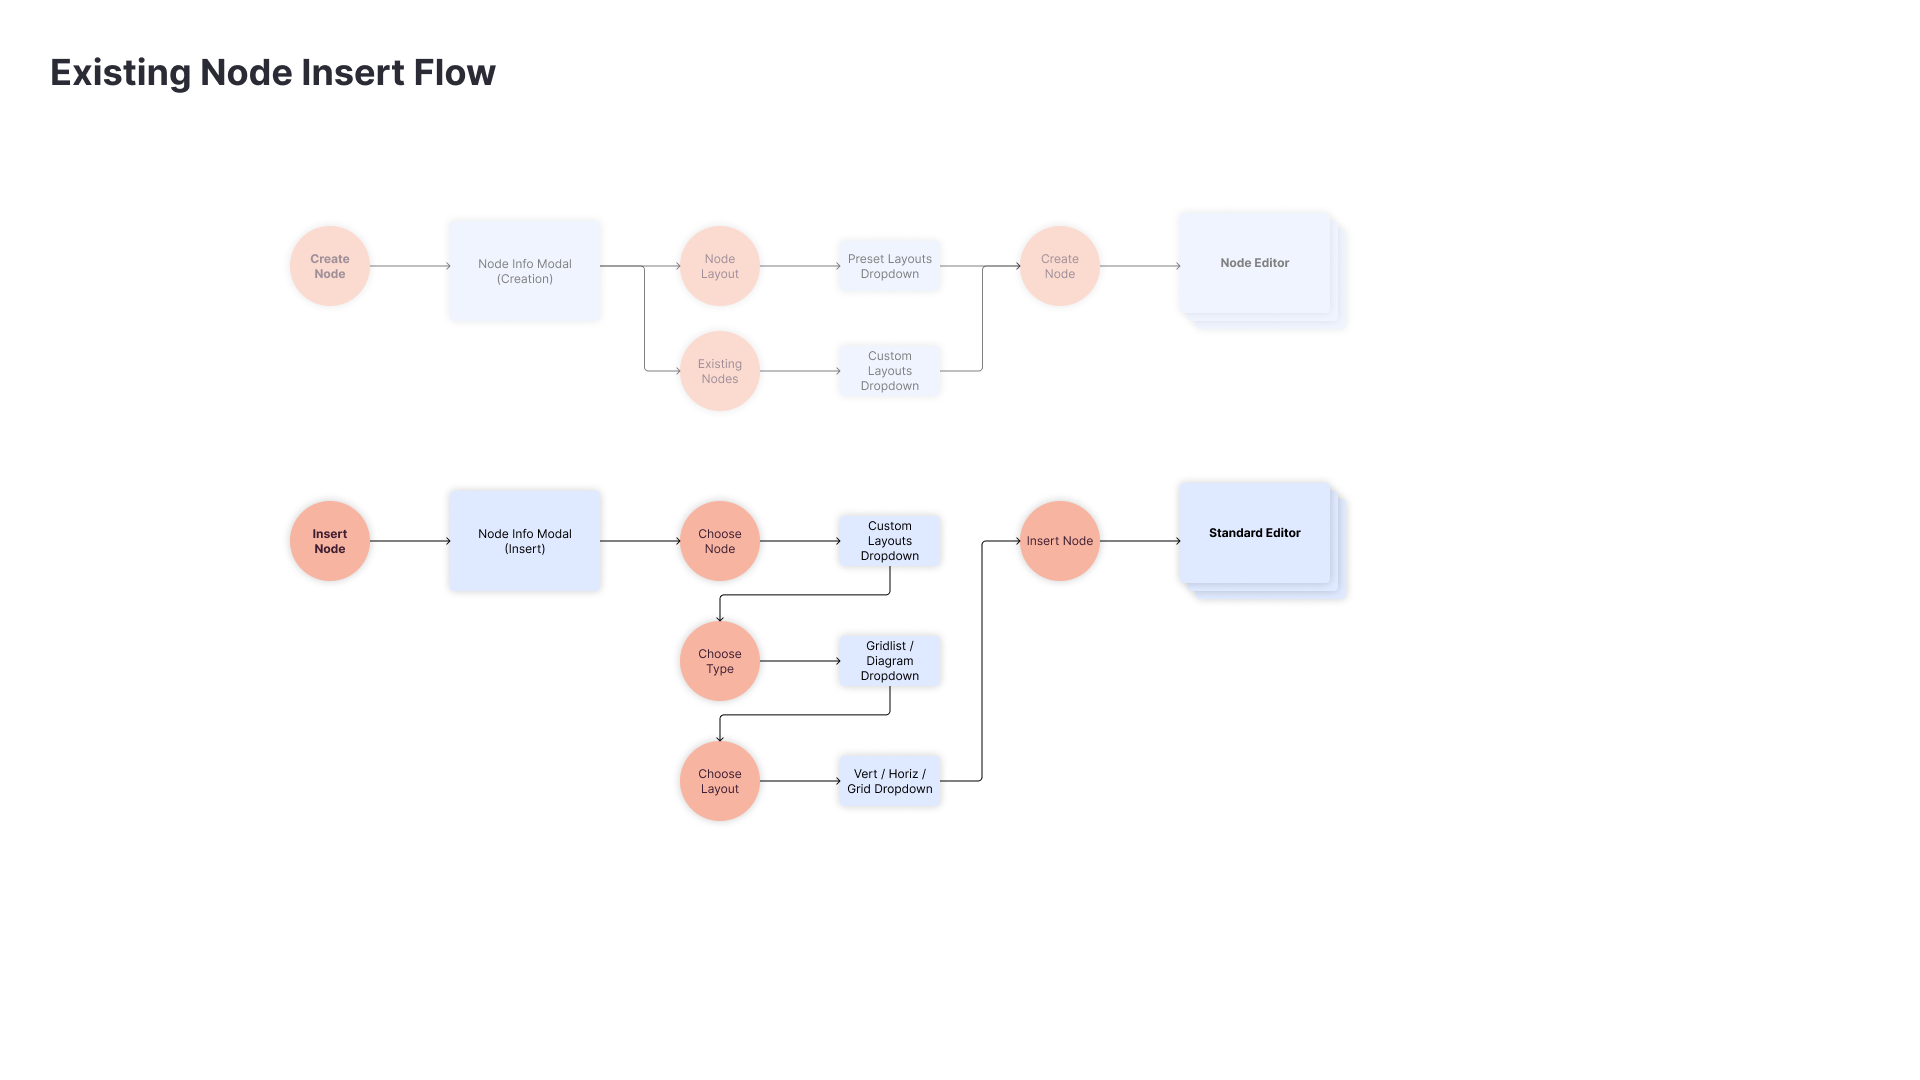
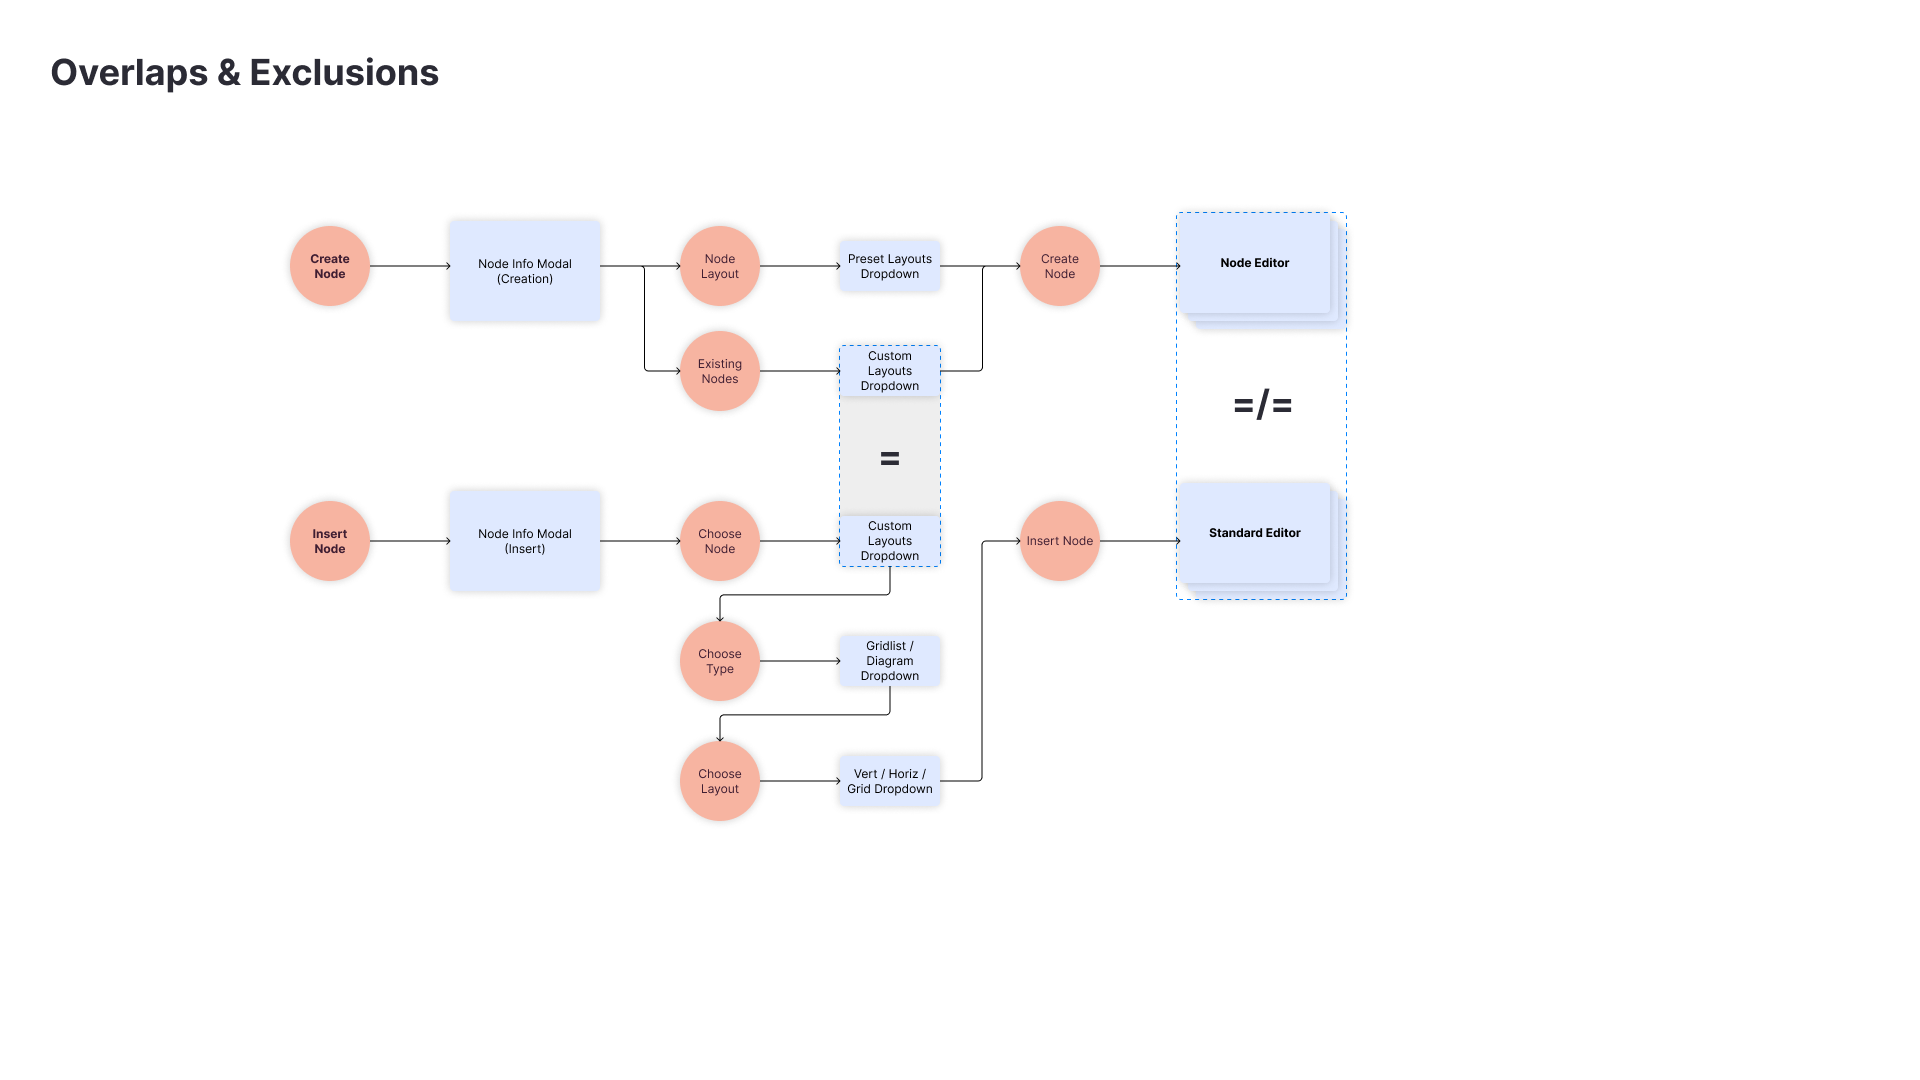
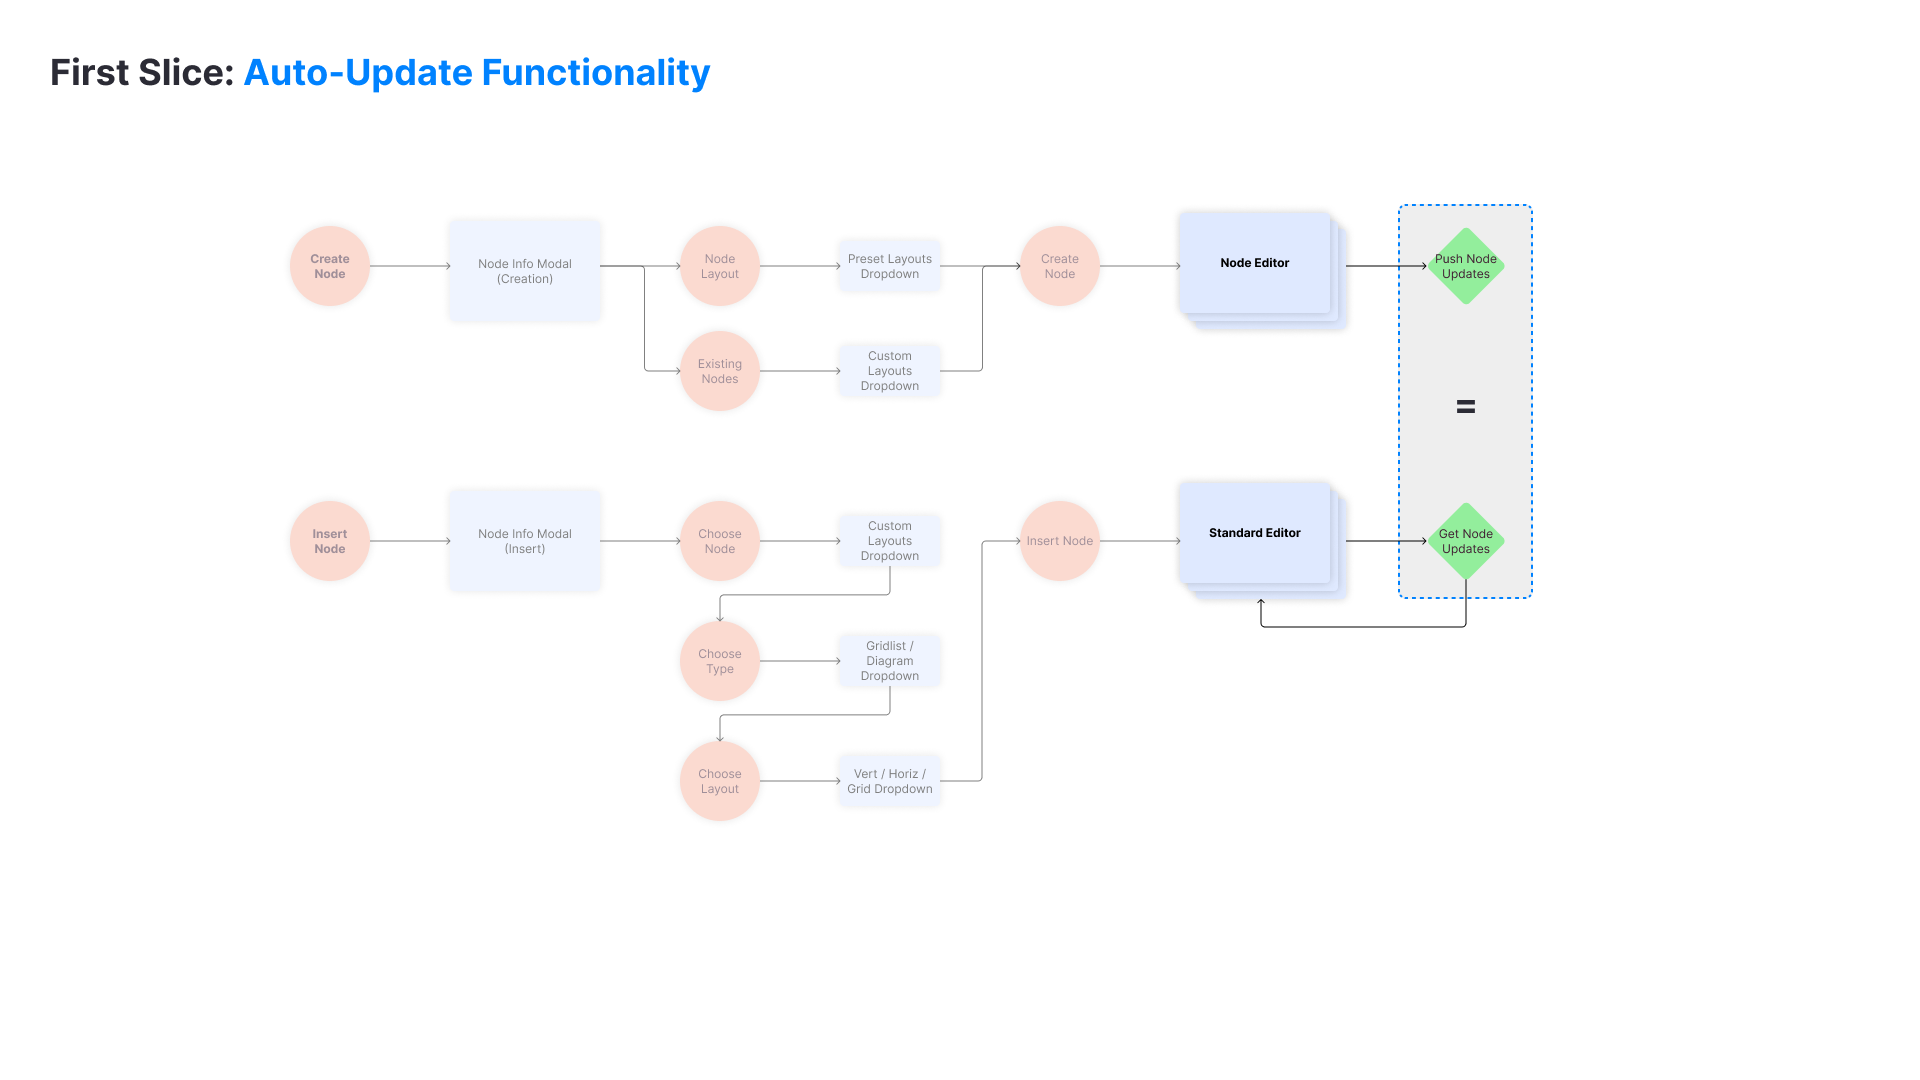
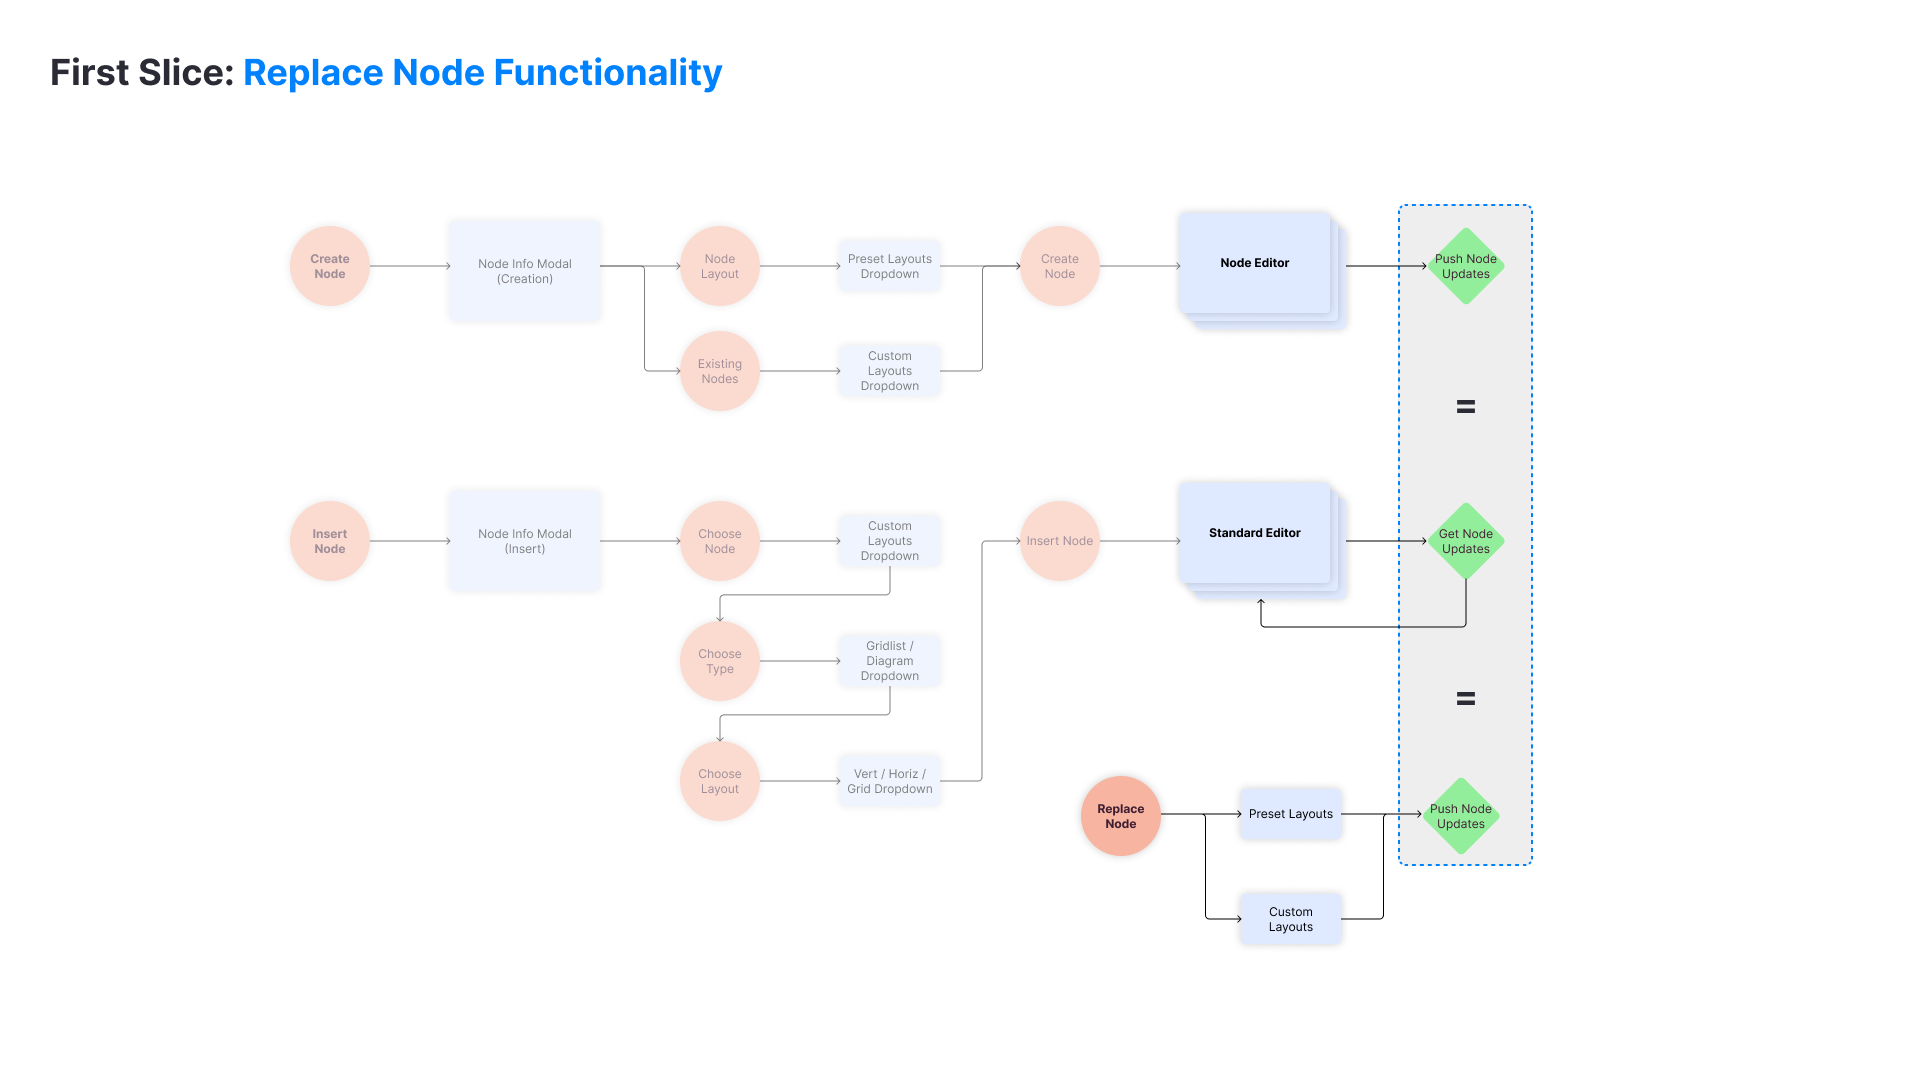
Redesigned Node Editor
Problem
When internal graphic designers need to create a new “Smart Diagram” for public use, there are severe limitations to the styles & editing options available to use.
How might we provide a simpler and more powerful workflow for our team to scale infographic production?
Technical Limitations
The new “Smart Diagram” elements exist on a seperate DOM (Document Object Model) layer, compared to typical legacy elements. A complete overhaul is out of the question due to time & resource constraints, so the solution must be compatible with two DOM layers.
User Jobs to be Done (JTBD)
The user group for this feature is the internal graphic designer team. As the company looks to scale up the A) speed of infographic production and B) convert over older diagrams to the newer “Smart Diagram” workflow, a newer and more efficient way of editing nodes is required.
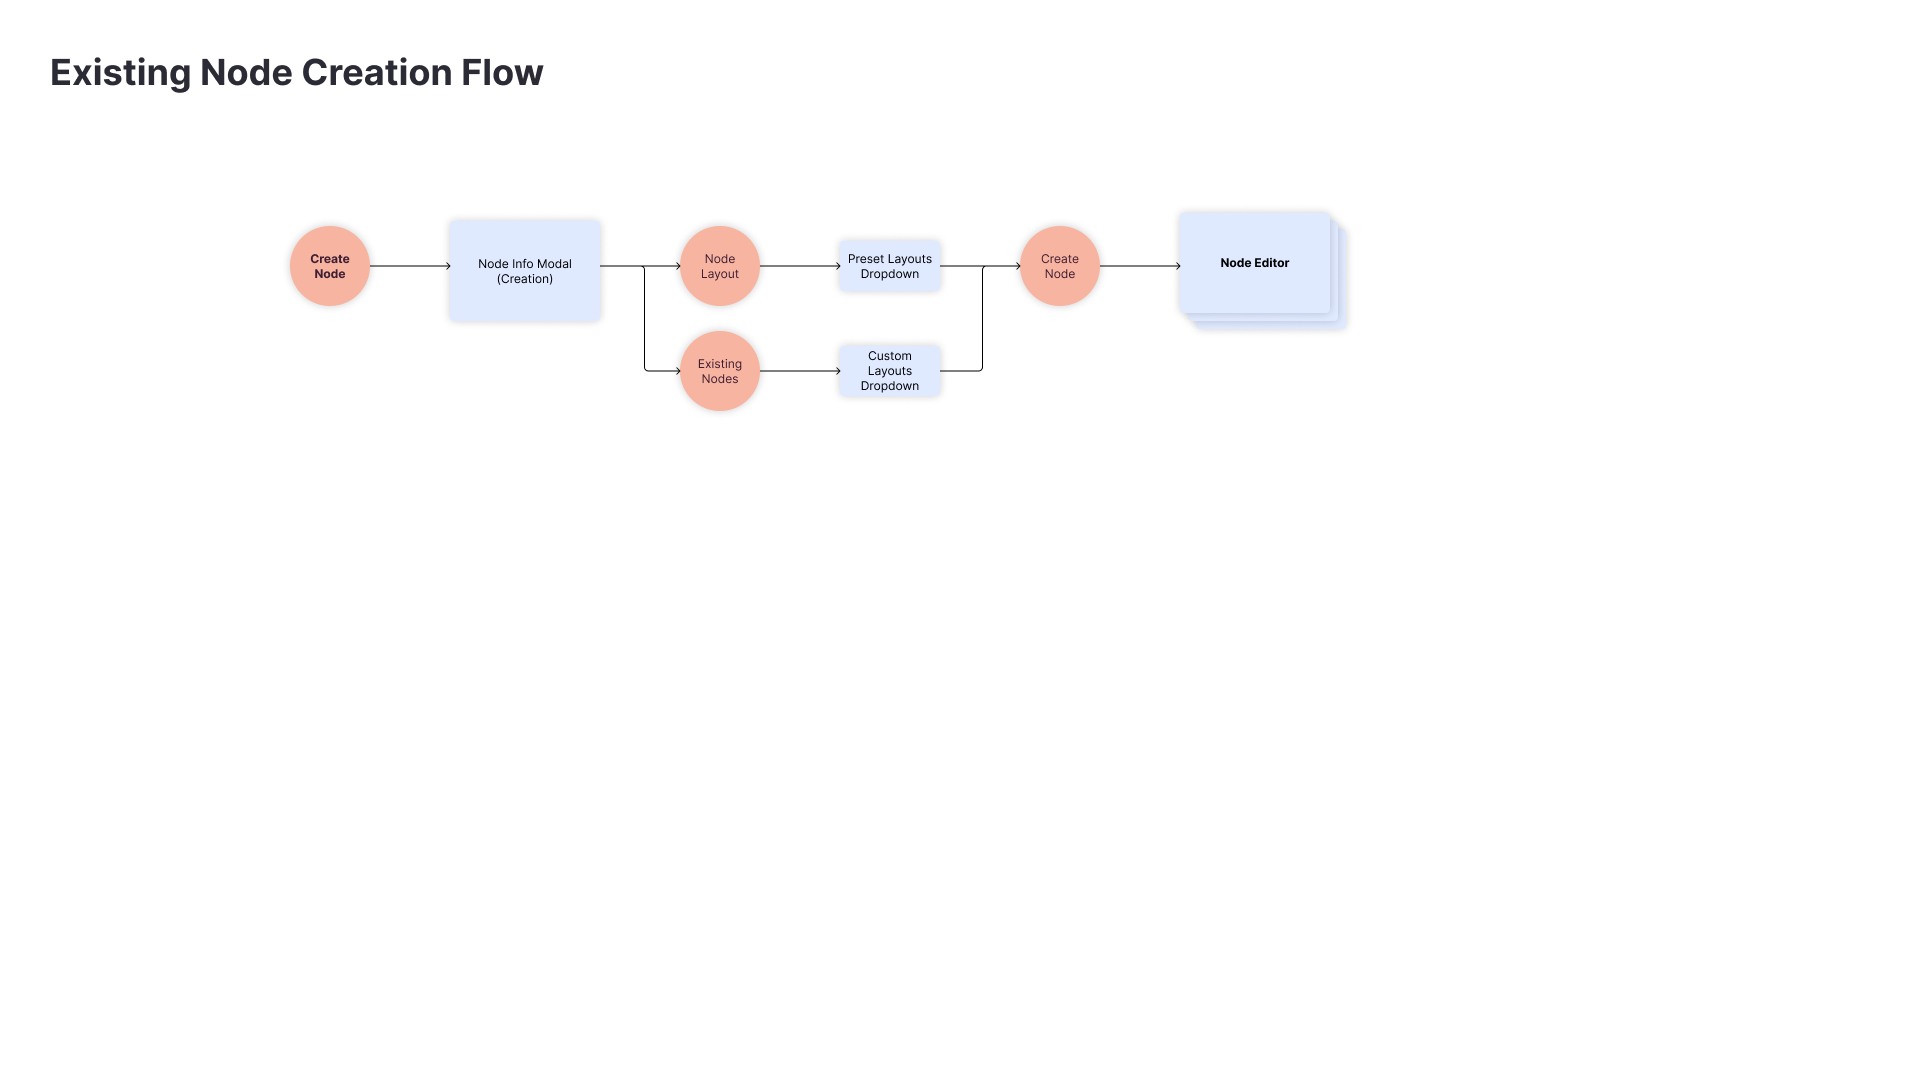
Mapping the User Flow
Charting how the existing process works & the pain points present in the flow allows the development of incremental improvements to the process. A “first slice” approach was taken to address the most pressing challenges first.
User Feedback, Sketching & Ideation
Numerous rounds of sketching & ideation with the engineering team was conducted to ensure what was possible with their resources. At the same time, user interviews & notes were taken from talks with the Graphic Design team as to how best to improve their workflow.
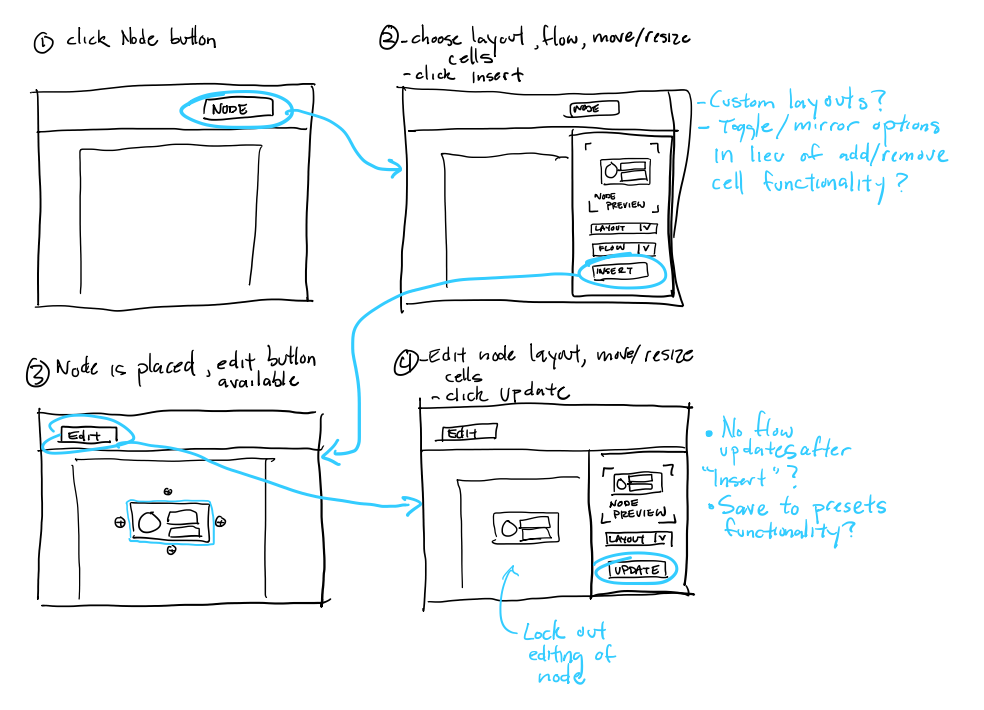
Solution
The solution of creating nodes within a collapsible sidebar editor window was developed alongside the engineering team. Careful consideration and constant back and forth communication with the developers was required to insure that the solution proposed can exist within time and technical constraints.